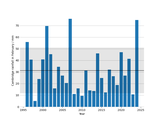
Just a quick (20 min) analysis of the rainfall in Cambridge in February since 1996 to see how wet it has been compared with previous years. Data are taken from the amateur-maintained weather station on the roof of the Cambridge University Computer Laboratory.
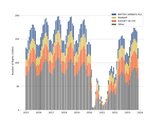
The UK Civil Aviation Authority (CAA) publishes regular statistics on the punctuality of flights arriving at and departing UK airports. These data can be retrieved with the script available on the GitHub repository accompanying this blog article: `get_data.py`.
The Digital Technology Group (DTG) at Cambridge University has been recording the weather from the roof of their building since 1995. The complete data are available to download in CSV format from the DTG website as the file weather-raw.csv. The script below visualizes these data …
As a companion script to this one on UK monthly temperatures the Met Office's data on rainfall can be compared in a similar way. The script below produces "raincloud" plots of the monthly rainfall since 1891 for two regions of the UK: East Anglia (relatively …
The UK Meteorological Office offers historical data of mean monthly temperatures in different regions of the UK for download. For the purposes of this blog post, I downloaded the data corresponding to two regions: Scotland.txt and South_England.txt. There are different ways of analysing these data …
The Python script below generates the following visualization of COVID deaths per 100,000 people for two classes of European country: those with less than 75% of the population vaccinated and those with at least this percentage vaccinated. The ongoing (as of January 2022) third wave …
In his 1986 book, Surely You're Joking, Mr. Feynman! physicist Richard Feynman writes: We have learned a lot from experience about how to handle some of the ways we fool ourselves. One example: Millikan measured the charge on an electron by an experiment with falling …
As of April 2020, there were 440 operational nuclear power reactors in the world. They are listed on this Wikipedia page, which can be scraped using the code at the bottom of this post for their important details, including their locations as latitude and longitude …
A Jupyter Notebook of this article is available here. The website goodreads.com lets readers rate books on a scale of 1 – 5 and also reports a "score" for lists of related books, according to some undisclosed algorithm. For the novels of Agatha Christie, a …
Five years ago, I wrote a blog post, "Is the frequency of intense tornadoes increasing?". Here is an updated plot, including tornadoes up to 2020 and accounting for the National Centers for Environmental Information (NCEI)'s use of the Enhanced Fujita scale – this includes the …