Scientific Programming with Python
This website contains resources, articles and tutorials on using Python for science and engineering applications. It also hosts supplementary material for my books, Learning Scientific Programming with Python and Python for Chemists.
My website contains more information about me and a recent list of publications.
The Kelvin wake pattern
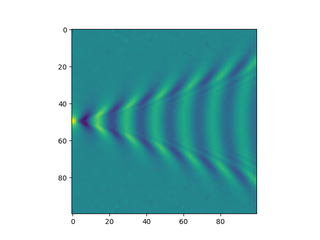
The simulated wake pattern behind an object moving at constant speed across a surface of water, first described by Lord Kelvin.
Linear least squares fitting of a two-dimensional data
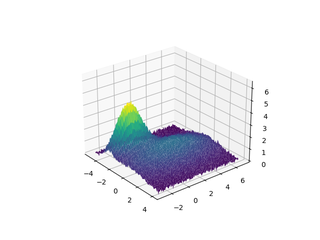
Least squares fitting of a two-dimensional polynomial to a surface.
A shallow neural network for simple nonlinear classification
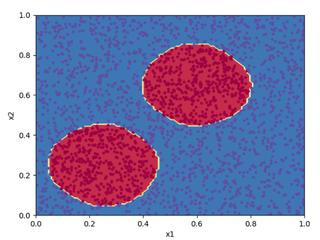
Classification problems are a broad class of machine learning applications devoted to assigning input data to a predefined category based on its features. If the boundary between the categories has a linear relationship to the input data, a simple logistic regression algorithm may do a good job. For more complex groupings, such as in classifying the points in the diagram below, a neural network can often give good results.