How wet was Cambridge in February?
Posted on 01 March 2024
Just a quick (20 min) analysis of the rainfall in Cambridge in February since 1996 to see how wet it has been compared with previous years. Data are taken from the amateur-maintained weather station on the roof of the Cambridge University Computer Laboratory.
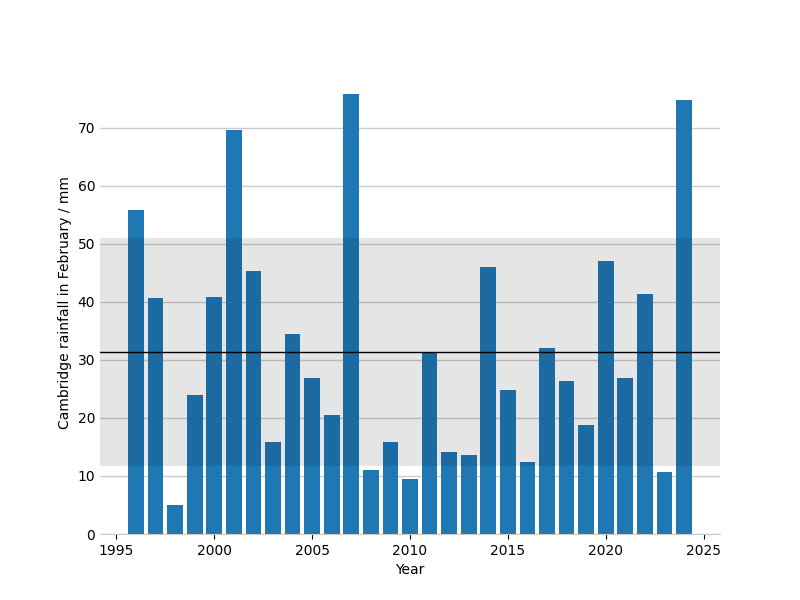
The mean rainfall for Cambridge is about 31.4 mm with a standard deviation of $\sigma = 19.6$ mm (indicated by the grey region on the plot). The rain measured in February 2024 was 74.8 mm, more than $2\sigma$ higher than the mean and the highest since 2007.
Getting the data files:
import sys
from pathlib import Path
import requests

FEB = "02"
ROOT_URL = "https://www.cl.cam.ac.uk/weather/data/period-text/"
DATA_DIR = Path("data")

year_min = 1996
year_max = 2024

def download_from_url(url):
    """Download the web page (or text data) from url."""
    page = requests.get(url)
    if page.status_code != 200:
        # If something goes wrong (e.g. server error or page
        # not found) then exit the script with the status code.
        print(f"Failed to download from {url}")
        print(f"Attempt failed with HTTP status code {page.status_code}")
        sys.exit(1)
    return page.text


for year in range(year_min, year_max+1):
    filename = f"{year}_{FEB}"
    print(filename)
    url = ROOT_URL + filename
    text_data = download_from_url(url)
    with open(DATA_DIR / filename, 'w') as fo:
        fo.write(text_data)
Extracting the February rainfall amounts:
from pathlib import Path

FEB = "02"
DATA_DIR = Path("data")
year_min, year_max = 1996, 2024

def get_rainfall(text_data):
    idx = text_data.index("Total Rainfall mm")
    s = text_data[idx:].split('\n')[1]
    return float(s)


rain_feb = {}
for year in range(year_min, year_max+1):
    filename = f"{year}_{FEB}"
    with open(DATA_DIR / filename) as fi:
        rain_feb[year] = get_rainfall(fi.read())

with open("feb_rain.csv", 'w') as fo:
    for year, rainfall in rain_feb.items():
        print(f"{year}, {rainfall}", file=fo)
Making the bar chart:
import numpy as np
import matplotlib.pyplot as plt
import matplotlib

filename = 'feb_rain.csv'
year, rainfall = np.genfromtxt(filename, delimiter=',', unpack=True)

# The rain sensor failed during February 2011, replace this year's
# value with the mean of the valid data.
mask = year==2011
idx = np.where(mask)[0]
mean = np.mean(rainfall[~mask])
std = np.std(rainfall[~mask])

print("Rainfall in Cambridge in February")
print(f"Mean: {mean:.1f} mm, standard deviation: {std:.2f} mm")

rainfall[idx] = mean

WIDTH, HEIGHT, DPI = 800, 600, 100
fig, ax = plt.subplots(figsize=(WIDTH/DPI, HEIGHT/DPI))
ax.set_axisbelow(True)
ax.bar(year, rainfall)

ax.axhline(mean, lw=1, c='k')
ax.axhspan(mean - std, mean + std, fc="k", alpha=0.1)

ax.set_xlabel("Year")
ax.set_ylabel("Cambridge rainfall in February / mm")
ax.spines["top"].set_visible(False)
ax.spines["right"].set_visible(False)
ax.spines["bottom"].set_color("#cccccc")
ax.spines["left"].set_visible(False)
ax.grid(axis="y", color="#cccccc", linewidth=1)
ax.yaxis.set_tick_params(length=0)
plt.show()