Raincloud plots comparing rainfall in Wales and East Anglia
Posted on 08 February 2022
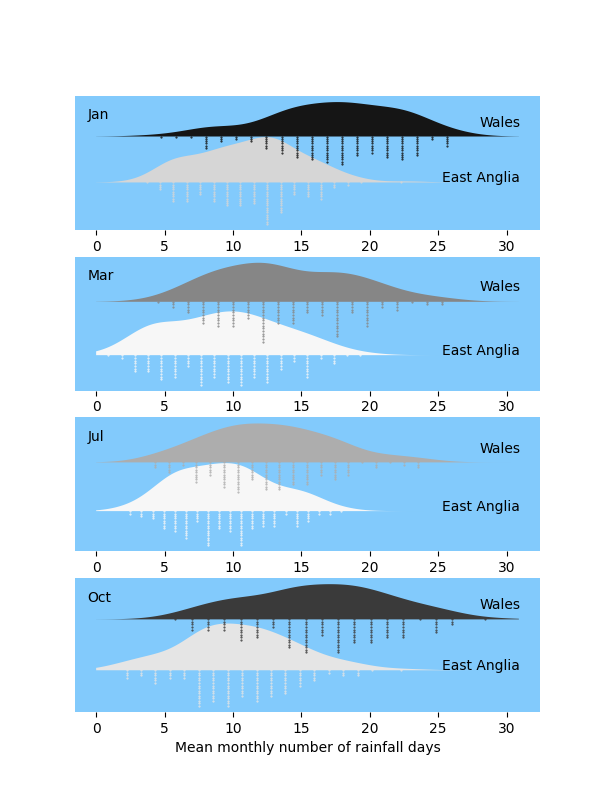
As a companion script to this one on UK monthly temperatures the Met Office's data on rainfall can be compared in a similar way. The script below produces "raincloud" plots of the monthly rainfall since 1891 for two regions of the UK: East Anglia (relatively dry) and Wales (notoriously wet). The "cloud" for each month is a kernel density estimate of the distribution of the number of days on which at least 1mm of rain falls; the "rain" is a histogram of the same data.
The files needed are East_Anglia-rain.txt and Wales-rain.txt.
import numpy as np
import pandas as pd
import matplotlib.pyplot as plt
from matplotlib.colors import Normalize
from matplotlib.offsetbox import AnchoredText
from scipy.stats import gaussian_kde
DPI = 100

def plot_monthly_raindays(df1, title1, df2, title2, month, ax):

    def plot_cloud(df, offset=0):
        """Plot a raincloud plot, offset vertically by offset data units."""

        # Get the mean rainfall days across all years for each month.
        mean_raindays = df[months].mean()
        # Get the corresponding colour from our colormap.
        c = cmap(norm(mean_raindays[month]))

        sep = 0.5
        # The cloud, as a KDE.
        dist = gaussian_kde(df[month])
        ax.fill_between(raindays, dist(raindays) * sep + offset, offset, fc=c)
        # The histogram of the rainy days
        hist, bin_edges = np.histogram(df[month], bins=20)
        # Plot the histogram as vertically falling "rain".
        x = (bin_edges[1:] + bin_edges[:-1]) / 2
        bottom = -hist * sep / 200 + offset
        for j, y in enumerate(bottom):
            if hist[j] == 0:
                continue
            xp = [x[j]] * hist[j]
            dy = (y - offset) / hist[j]
            yp = [offset + i*dy for i in range(hist[j])]
            ax.scatter(xp, yp, s=1, marker='.', color=c)

    # Plot the two distributions as raincloud plots.
    plot_cloud(df1, 0)
    plot_cloud(df2, 0.05)
    ax.yaxis.set_visible(False)

    ax.set_xlabel(r'Number of rainy days per month')
    ax.spines['top'].set_visible(False)
    ax.spines['right'].set_visible(False)
    ax.spines['bottom'].set_visible(False)
    ax.spines['left'].set_visible(False)

    # Annotate with the month and the title (region of the UK).
    at = AnchoredText(
        month.title(), frameon=False, loc='upper left')
    ax.add_artist(at)
    ax.text(31, 0, title1, ha='right')
    ax.text(31, 0.06, title2, ha='right')

# Read in the data to two separate pandas DataFrames.
filename1, title1 = 'East_Anglia-rain.txt', 'East Anglia'
filename2, title2 = 'Wales-rain.txt', 'Wales'
df1 = pd.read_csv(filename1, sep='\s+', skiprows=5, header=0,
                 index_col=0).dropna()

df2 = pd.read_csv(filename2, sep='\s+', skiprows=5, header=0,
                 index_col=0).dropna()
months = df1.columns[:12]
raindays = np.arange(0, 31, 0.1)
cmap = plt.get_cmap('Greys')

# Get the minimum and maximum number of rainy days across both DataFrames,
# to normalize the colormap on.
df = pd.concat([df1[months].mean(), df2[months].mean()])
min_raindays, max_raindays = df.min(), df.max()
norm = Normalize(vmin=min_raindays, vmax=max_raindays)

fig, axes = plt.subplots(nrows=4, ncols=1, figsize=(600/DPI, 800/DPI), dpi=DPI)
axes[0].set_facecolor('xkcd:sky')
axes[1].set_facecolor('xkcd:sky')
axes[2].set_facecolor('xkcd:sky')
axes[3].set_facecolor('xkcd:sky')
plot_monthly_raindays(df1, title1, df2, title2, 'jan', axes[0])
plot_monthly_raindays(df1, title1, df2, title2, 'mar', axes[1])
plot_monthly_raindays(df1, title1, df2, title2, 'jul', axes[2])
plot_monthly_raindays(df1, title1, df2, title2, 'oct', axes[3])

plt.savefig('rainfall.png')
plt.show()