Analysing flight punctuality data for UK airports: I. Basic statistics for 2022
Posted on 09 February 2024
The UK Civil Aviation Authority (CAA) publishes regular statistics on the punctuality of flights arriving at and departing UK airports. These data can be retrieved with the script available on the GitHub repository accompanying this blog article: get_data.py.
Obtaining the data
First clone the repository somewhere and create a directory data; then create a suitable virtual environment using the repository's requirements.txt file and run the following command for each year you want data for:
python get_data.py <YYYY>
Data for each month of year YYYY are written in CSV format to the files data/YYYY/YYYYMM.csv.
Basic statistics for 2022
At the time of writing the last year for which a full data set exists is 2022. The punctuality data from this year can be used to determine some basic statistics using standard methods in the pandas library. The code below is available in the script summarize_year.py.
First some imports, read in the data for 2022 and do some tidying:
import sys
from pathlib import Path
import pandas as pd

year = 2022

# The local directory in which the downloaded CSV files are saved.
DATA_DIR = Path("data")
csv_files = DATA_DIR.glob(f"{year}/*.csv")

# Read all the CSV data into a single DataFrame.
df = pd.concat(pd.read_csv(csv_file) for csv_file in csv_files)
print(f"{len(df)} rows read in.")

# List the column names (header).
print(df.columns)

# Drop some columns we don't care about.
df.drop(["run_date",
         "previous_year_month_flights_matched",
         "previous_year_month_early_to_15_mins_late_percent",
         "previous_year_month_average_delay",
        ], axis=1, inplace=True)
To find the total number of flights contributing to the dataset:
print(df['number_flights_matched'].sum(), f"flights in {year}")

1528989 flights in 2022
There are many airports reporting data and even more airlines, but some are small with only a few flights. To determine which the major ones are we can use pandas' groupby() as follows:
grouped_by_airport = df.groupby("reporting_airport")
nflights_by_airport = grouped_by_airport[
        "number_flights_matched"].sum().sort_values()
print(nflights_by_airport)

reporting_airport
SOUTHEND                             586
TEESSIDE INTERNATIONAL AIRPORT      3410
BOURNEMOUTH                         4948
DONCASTER SHEFFIELD                 5692
EXETER                              5898
CARDIFF WALES                       6656
ISLE OF MAN                         7979
SOUTHAMPTON                        15473
JERSEY                             15693
EAST MIDLANDS INTERNATIONAL        21080
BELFAST CITY (GEORGE BEST)         24230
LEEDS BRADFORD                     25378
ABERDEEN                           25382
LIVERPOOL (JOHN LENNON)            26350
NEWCASTLE                          30860
BELFAST INTERNATIONAL              33823
LONDON CITY                        42932
BRISTOL                            55668
GLASGOW                            57065
BIRMINGHAM                         68865
LUTON                              85041
EDINBURGH                          86725
STANSTED                          149112
MANCHESTER                        149222
GATWICK                           213991
HEATHROW                          366930
Name: number_flights_matched, dtype: int64
As expected, London Heathrow is by far the busiest airport, but some only handle a dozen or so flights a day. Here we will store the names of all airports with more than 10000 flights reported in 2022 for the later analysis:
busiest_airports = nflights_by_airport[nflights_by_airport >= 10000]
# Output the list of busiest airports in descending order of
# number of flights.
busiest_airports.iloc[::-1].to_csv('busiest_airports.txt', columns=[],
                                   header=False)
Similarly for the airlines:
grouped_by_airline = df.groupby("airline_name")
nflights_by_airline = grouped_by_airline [
        "number_flights_matched"].sum().sort_values()
print(nflights_by_airline)

airline_name
SUN AIR JETS                 0
MALMO AVIATION               0
DANISH AIR TRANSPORT         0
FLYING SERVICE               0
GARUDA INDONESIA             0
                         ...
LOGANAIR LTD             62678
JET2.COM LTD             92306
BRITISH AIRWAYS PLC     226469
RYANAIR                 251767
EASYJET UK LTD          302852
Name: number_flights_matched, Length: 305, dtype: int64
In this list British Airways appears as the third largest airline but probably because its various subsidiaries, such as BA CityFlyer, are listed separately; including these, it would rank second. For later reference, we will output a list of all airlines operating at least 1000 flights in 2022:
biggest_airlines = nflights_by_airline[nflights_by_airline >= 1000]
# Output the list of biggest airlines in descending order of
# number of flights.
biggest_airlines.iloc[::-1].to_csv('biggest_airlines.txt', columns=[],
                                   header=False)
Finally, we can aggregate the flight delay statistics by airport and by airline:
delay_by_airport = grouped_by_airport["average_delay_mins"].mean().sort_values()
delay_by_busy_airport = delay_by_airport[
        delay_by_airport.index.isin(busiest_airports.index)]
print(delay_by_busy_airport.iloc[::-1])

reporting_airport
BIRMINGHAM                     31.283159
MANCHESTER                     30.480628
BRISTOL                        30.295406
LUTON                          28.952210
GATWICK                        28.290749
ABERDEEN                       26.225369
EDINBURGH                      24.734311
NEWCASTLE                      23.505970
HEATHROW                       22.912394
GLASGOW                        21.610352
JERSEY                         21.589021
STANSTED                       20.628472
LEEDS BRADFORD                 19.943644
LIVERPOOL (JOHN LENNON)        19.641653
BELFAST INTERNATIONAL          19.046317
SOUTHAMPTON                    17.038462
BELFAST CITY (GEORGE BEST)     16.739970
EAST MIDLANDS INTERNATIONAL    16.012865
LONDON CITY                    15.779507
Name: average_delay_mins, dtype: float64
The average delay for flights from Birmingham was over half an hour.
For the airlines:
delay_by_airline = grouped_by_airline["average_delay_mins"].mean().sort_values()
delay_by_biggest_airline = delay_by_airline[
        delay_by_airline.index.isin(biggest_airlines.index)]

# Output the top 20 most delayed airlines:
print(delay_by_biggest_airline.iloc[:-20:-1])

airline_name
QANTAS                    53.406780
WIZZ AIR UK LTD           44.229892
CORENDON AIRLINES         43.556054
GULF AIR                  41.738095
TUI AIRWAYS LTD           39.858694
WEST JET AIRLINES         37.990909
WIZZ AIR                  34.729339
CATHAY PACIFIC AIRWAYS    33.840909
SUNEXPRESS                33.664894
AIR INDIA                 32.276498
AIR MALTA                 30.826087
KUWAIT AIRWAYS            29.125000
SAUDI ARABIAN AIRLINES    28.760000
AIR CANADA                28.402878
STOBART AIR               27.447368
RYANAIR UK LTD            26.758824
FLYBE LTD                 26.412946
AIR TRANSAT               26.090909
BRITISH AIRWAYS PLC       25.949737
Name: average_delay_mins, dtype: float64
Quantas may never crash but they are apparently quite frequently late.
Flight numbers 2015 – 2023
With a bit of extra tidying, the data set can be analysed for the number of flights in each month, broken down for the top three airlines identified above. The code in this section is available as the script plot_flights_history.py.
# Get all data for dates 2015 – 2023.
years = range(2015, 2024)
csv_files = [f for year in years for f in DATA_DIR.glob(f"{year}/{year}*.csv")]

# Read all the CSV data into a single DataFrame.
df = pd.concat(pd.read_csv(csv_file) for csv_file in csv_files)
print(f"{len(df)} rows read in.")

# Total number of flights for the whole data set.
print(df["number_flights_matched"].sum(), f"flights in data set.")

df["date"] = pd.to_datetime(df["reporting_period"], format="%Y%m")

biggest_airlines = ["EASYJET UK LTD", "RYANAIR", "BRITISH AIRWAYS PLC"]

# Annoyingly, the way EasyJet is referred to changed in the
# data sets at some point.
df["airline_name"] = [
    "EASYJET UK LTD" if airline_name == "EASYJET AIRLINE COMPANY LTD"
               else airline_name
    for airline_name in df["airline_name"]
]

df["airline_name"] = [
    airline_name if airline_name in biggest_airlines else "Other"
    for airline_name in df["airline_name"]
]
grouped_by_airline = df.groupby("airline_name")
nflights_by_airline = grouped_by_airline["number_flights_matched"].sum().sort_values()
print(nflights_by_airline)

# Colours to identify different airlines.
colours = {
    "Other": "#666666",
    "BRITISH AIRWAYS PLC": "#395b95",
    "EASYJET UK LTD": "#ec5f2a",
    "RYANAIR": "#d8ba4d",
}


##### Number of flights each month ######
grouped_by_month = df.groupby(["airline_name", "date"])
flights_per_month = grouped_by_month["number_flights_matched"].sum()

fig, ax = plt.subplots()
ax.set_axisbelow(True)

# To build a stacked bar chart, keep track of the height of the
# previous bars in the array last_values.
last_values = np.array(
    [0] * (len(flights_per_month.index) // (len(biggest_airlines) + 1))
)
for airline_name in ["Other"] + biggest_airlines:
    nflights = flights_per_month[airline_name].values
    ax.bar(
        flights_per_month[airline_name].index,
        nflights,
        bottom=last_values,
        width=20,
        fc=colours[airline_name],
        label=airline_name,
    )
    last_values += nflights
ax.xaxis_date()

# Do a bit of styling to improve the look of the bar chart.
yticks = np.arange(0, 201, 50)
ax.set_yticks(yticks * 1000)
ax.set_yticklabels([str(e) for e in yticks])
ax.set_ylabel("Number of flights (1000s)")
plt.legend(reverse=True)
ax.spines["top"].set_visible(False)
ax.spines["right"].set_visible(False)
ax.spines["bottom"].set_color("#cccccc")
ax.spines["left"].set_visible(False)
ax.grid(axis="y", color="#cccccc", linewidth=1)
ax.yaxis.set_tick_params(length=0)
plt.show()
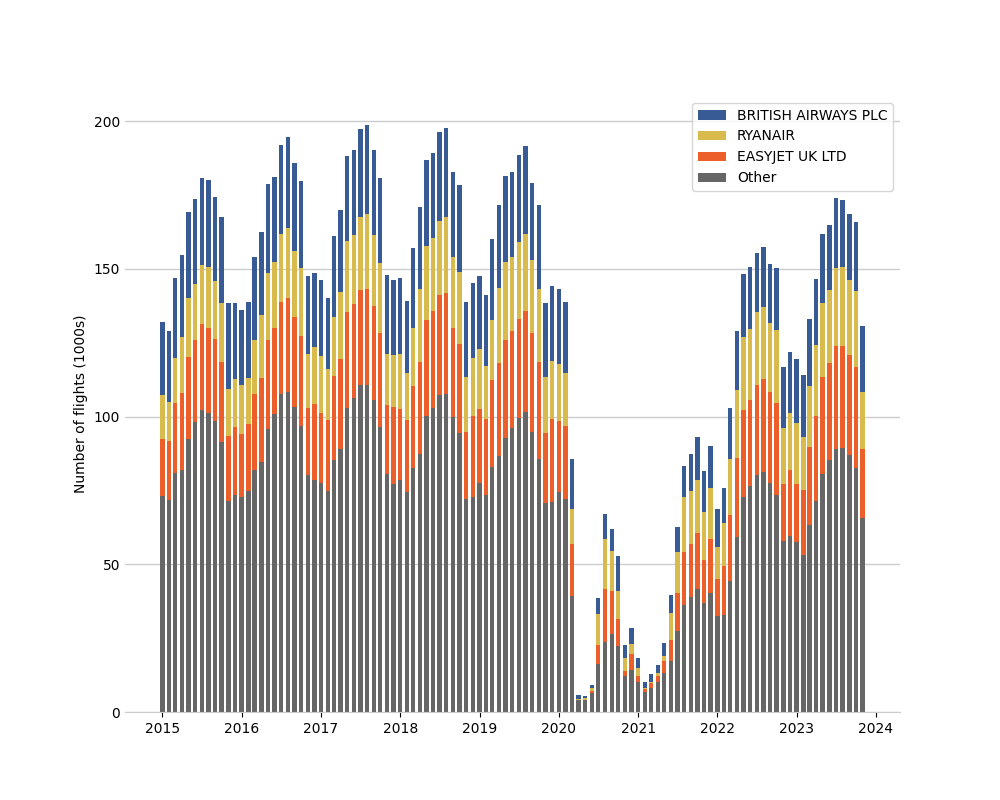
Some observations: The effect of the COVID pandemic in 2020 – 2021 is obvious and flight numbers have yet to recover fully to their pre-pandemic levels. There is also a clear seasonal variation in flight numbers with higher demand in the (northern hemisphere) summer.
Flight delays 2015 – 2023
A similar approach can be taken to analysing the average delays for each airline, here expressed as a difference from the mean delay.
grouped_by_month = df.groupby(["airline_name", "date"])
delay_per_month = grouped_by_month["average_delay_mins"].mean()
average_delay_per_month = delay_per_month.groupby("date").mean()

fig, ax = plt.subplots()
for airline_name in biggest_airlines:
    dates = delay_per_month[airline_name].index
    delay = delay_per_month[airline_name].values
    colour = colours[airline_name]
    ax.plot(
        dates,
        delay - average_delay_per_month,
        label=airline_name,
        lw=2,
        c=colour,
    )
plt.legend(reverse=True)
ax.set_ylabel("Delay - Average Delay (mins)")
plt.legend(reverse=True)
ax.spines["top"].set_visible(False)
ax.spines["right"].set_visible(False)
ax.spines["bottom"].set_color("#cccccc")
ax.spines["left"].set_visible(False)
ax.grid(axis="y", color="#cccccc", linewidth=1)
ax.yaxis.set_tick_params(length=0)
plt.show()
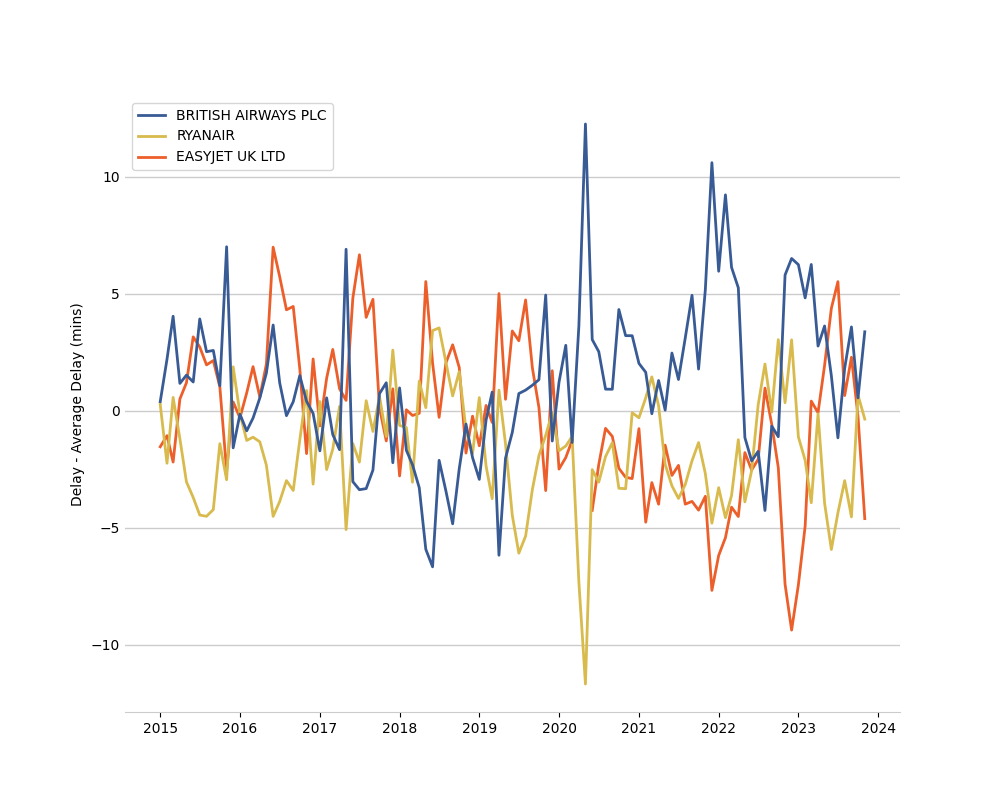
Some observations: BA didn't do well during and in the immediate aftermath of the pandemic. The comparison with Ryanair and EasyJet may not be entirely fair, because only BA flies long haul routes (for which a typical delay of 30 minutes or so may not be as big a deal).
Comparing airline delays
This code is available as compare_flights.py. In this section we will deal only with departures of scheduled flights from 2022 onwards and compare the mean delays from different airlines operating the same route.
# Get all data for dates 2022 – 2023.
years = range(2022, 2024)
csv_files = [f for year in years
               for f in DATA_DIR.glob(f"{year}/{year}*.csv")]

# Read all the CSV data into a single DataFrame.
df = pd.concat(pd.read_csv(csv_file) for csv_file in csv_files)
print(f"{len(df)} rows read in.")

# Drop every row apart from scheduled (S) departures (D).
df = df[df['arrival_departure']=='D']
df = df[df['scheduled_charter']=='S']
# Drop rows if there are no matched flights for that month.
df = df[df['number_flights_matched']>0]
print(f"{len(df)} rows for scheduled departures.")

# Total number of flights for the whole data set.
print(df['number_flights_matched'].sum(), f"flights in data set.")

df['date'] = pd.to_datetime(df['reporting_period'], format="%Y%m")

# Compare airlines flying between London Heathrow and Vienna.
df1 = df[(df["reporting_airport"]=="HEATHROW")
        & (df["origin_destination"]=="VIENNA")]
df1 = df1[["airline_name", "average_delay_mins"]]
df1 = df1.groupby("airline_name").mean()
print(df1)

Output:

                         average_delay_mins
    airline_name
    AUSTRIAN AIRLINES             15.434783
    BRITISH AIRWAYS PLC           21.434783
    TITAN AIRWAYS LTD             57.000000
The third entry in this summary corresponds to a single flight, apparently made by Titan Airways in March 2023.
Similarly, to compare airlines flying LHR–LAX:
df2 = df[(df["reporting_airport"]=="HEATHROW")
         & (df["origin_destination"]=="LOS ANGELES INTERNATIONAL")]
df2 = df2[["airline_name", "average_delay_mins"]]
df2 = df2.groupby("airline_name").mean()
print(df2)

                             average_delay_mins
airline_name
AMERICAN AIRLINES                     20.695652
BRITISH AIRWAYS PLC                   29.565217
DELTA AIRLINES                        16.000000
UNITED AIRLINES                       17.150000
VIRGIN ATLANTIC AIRWAYS LTD           16.826087