The equation of the circle through three points
Posted on 14 October 2023
The equation of the circle containing three (non-colinear) points can be found using the following procedure.
Let the three points be $A: (a, b)$, $B: (c, d)$ and $C: (x_0, y_0)$. The equation of a circle with diameter $\overline{AB}$ is:
$$ f(x, y) = (x-a)(x-c) + (y-b)(y-d) = 0 $$
and the equation of the line through $\overline{AB}$ is
$$ y - b = \frac{d-b}{c-a}(x-a) \Rightarrow g(x, y) = (b-d)x - (a-c)y + ad - bc = 0. $$
It can be shown that that there exists a number $\alpha$ such that $f(x,y) = \alpha g(x,y)$ is the equation of the circle through $A$, $B$ and $C$. By direct substitution of the coordinates of $C$, the value of $\alpha$ is:
$$ \alpha = \frac{(x_0-a)(x_0-c) + (y_0-b)(y_0-d)}{(b-d)x_0 - (a-c)y_0 +ad - bc}. $$
Substituting the above expressions for $f(x,y)$ and $g(x,y)$ and completing the square leads to the following convenient form for the equation of the circle:
$$ \begin{align*} \left[ x - \frac{(a+c) + \alpha(b-d)}{2}\right]^2 + \left[ y - \frac{(b+d) + \alpha(a-c)}{2}\right]^2 = \alpha (ad - bc) \\ \quad\quad\quad - ac - bd + \frac{[(a+c) + \alpha(b-d)]^2}{4} + \frac{[(b+d) + \alpha(a-c)]^2}{4}. \end{align*} $$
That is, the circle is centered on
$$ (x_\mathrm{c}, y_\mathrm{c}) = \left( \frac{(a+c) + \alpha(b-d)}{2}, \frac{(b+d) + \alpha(a-c)}{2} \right) $$
and has radius
$$ r = \sqrt{\alpha (ad - bc) - ac - bd + \frac{[(a+c) + \alpha(b-d)]^2}{4} + \frac{[(b+d) + \alpha(a-c)]^2}{4}}. $$
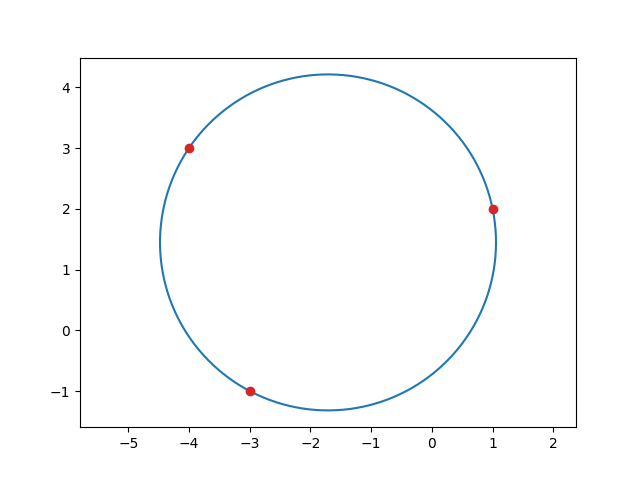
The code below demonstrates the use of this formula for the points $(-3, -1)$, $(-4, 3)$ and $(1, 2)$.
import numpy as np
import matplotlib.pyplot as plt

A, B, C = (-3, -1), (-4, 3), (1, 2)

a, b = A
c, d = B
x0, y0 = C

alpha = ((x0-a)*(x0-c) + (y0-b)*(y0-d)) / ((b-d)*x0 - (a-c)*y0 + a*d - b*c)

xc = ((a+c) + alpha*(b-d)) / 2
yc = ((b+d) - alpha*(a-c)) / 2
r2 = alpha * (a*d - b*c) - a*c - b*d + xc**2 + yc**2
r = np.sqrt(r2)

th = np.arange(0, 2*np.pi, 0.01)
x, y = r * np.cos(th) + xc, r * np.sin(th) + yc

plt.plot(x, y)
plt.scatter(*np.array((A, B, C)).T, c='tab:red', zorder=2)
plt.gca().axis('equal')
plt.show()