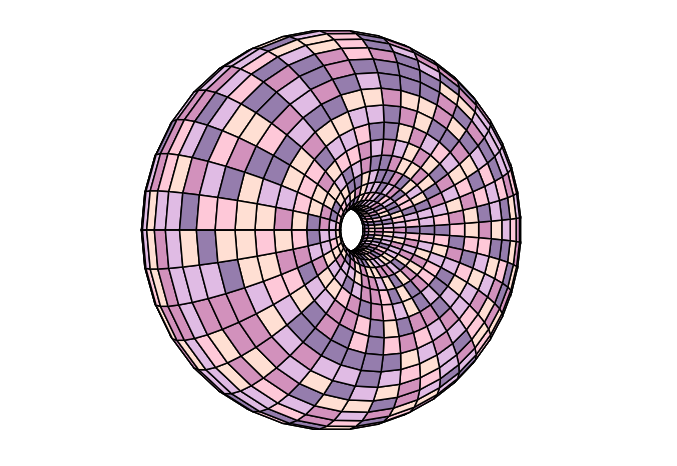
Depicting a torus as an SVG image
Posted on 30 November 2018
SVG may not be the most obvious choice for depicting a 3-D object, but with some care over the perspective and ordering of the plotted points, it can be done.
The code is below and relies on a single import for the colour scheme, palettes.py, also below.
import numpy as np
from palettes import colour_funcs

# The major and minor radius of the torus.
c, a = 1.5, 1.2
# Pick a colour scheme from the get_colours dictionary
palette = 'pastels'
# Image dimensions and scaling factors from torus units to image units.
width, height = 800, 600
scalex, scaley = 140, 140
# Tait-Bryan angles for intrinsic rotation of the figure.
alpha, beta, gamma = 90, 25, 0
# Camera position, C, and projection plane position, E (relative to C).
cx, cy, cz = 0, 6, 0
ex, ey, ez = 0, 3, 0
# Number of quads per 2.pi radians around each angular coordinate.
ntheta, nphi = 40, 40

def preamble(fo):
    """The SVG preamble and styles."""

    print('<?xml version="1.0" encoding="utf-8"?>\n'

    '<svg xmlns="http://www.w3.org/2000/svg"\n' + ' '*5 +
       'xmlns:xlink="http://www.w3.org/1999/xlink" width="{}" height="{}" >'
            .format(width, height), file=fo)

    print("""
        <defs>
        <style type="text/css"><![CDATA[""", file=fo)

    print('path {stroke-width: 1.5px; stroke: #000;}', file=fo)

    print("""]]></style>
    </defs>""", file=fo)

def get_xyz(theta, phi):
    """Get the cartesian coordinates of a point on the torus."""

    x = (c + a*np.cos(theta)) * np.cos(phi)
    y = (c + a*np.cos(theta)) * np.sin(phi)
    z = a * np.sin(theta)
    return x, y, z

def rotate_xyz(xyz, alpha, beta, gamma):
    """Rotate the point(s) P=xyz by Rz(alpha)Ry(beta)Rx(gamma).P"""

    alpha, beta, gamma = np.radians(alpha), np.radians(beta), np.radians(gamma)
    ca, sa = np.cos(alpha), np.sin(alpha)
    Rz = np.array(((1,0,0),(0,ca,-sa),(0,sa,ca)))
    cb, sb = np.cos(beta), np.sin(beta)
    Ry = np.array(((cb,0,sb),(0,1,0),(-sb,0,cb)))
    cg, sg = np.cos(gamma), np.sin(gamma)
    Rx = np.array(((cg,-sg,0),(sg,cg,0),(0,0,1)))
    R = Rz @ Ry @ Rx
    return xyz @ R.T

# Create a mesh of points on the two angular coordinates, theta and phi.
theta = np.linspace(0, 2.*np.pi, ntheta)
phi = np.linspace(0, 2.*np.pi, nphi)
theta, phi = np.meshgrid(theta, phi)

# Get the points on the mesh and rotate the torus by the specified angles.
x, y, z = get_xyz(theta, phi)
xyz = np.stack((x, y, z), axis=-1)
xyz = rotate_xyz(xyz, alpha, beta, gamma)
x, y, z = xyz.T

def apply_perspective(ax, ay, az):
    """
    Simple perspective projection of point A onto display plane at E
    as seen by camera at C.

    """

    dx, dy, dz = ax-cx, ay-cy, az-cz
    bx = ey/dy*dx + ex
    bz = ey/dy*dz + ez
    return bx, bz

bx, by = apply_perspective(x, y, z)

# Calculate the coordinates of the quads, and keep track of each quad's
# mean position in the y-axis (depth-axis) in ypos.
quads, ypos = [], []
# To look inside the torus, we may not want to draw it all. Specify the
# indexes of the phi coordinates of the quads to draw as j1, j2 here:
j1, j2 = nphi//2, nphi
j1, j2 = 0, nphi
ni, nj = ntheta, j2-j1
quads = np.empty((ni*nj,4,2))
for i in range(ntheta):
    for j in range(j1, j2):
        ip, jp = (i+1) % ntheta, (j+1) % nphi
        ym = np.mean( (y[i,j], y[ip,j], y[ip,jp], y[i,jp]) )
        quads[i*nj+j-j1] = ((bx[i,j], by[i,j]), (bx[ip,j], by[ip,j]),
                     (bx[ip,jp], by[ip,jp]), (bx[i,jp], by[i,jp]))
        ypos.append(ym)
# Get the indexes of the quads sorted by their distance from the camera.
idy = np.argsort(ypos)

# Draw the torus as a SVG image.
get_colour = colour_funcs[palette]
with open('torus.svg', 'w') as fo:
    preamble(fo)
    for i in idy:
        quad = quads[i] * (scalex, scaley) + (width/2, height/2)
        p1,p2,p3,p4 = quad
        colour = get_colour(i, idy)
        print('<path d="M{},{} L{},{} L{},{} L{},{} Z" fill="{}"/>'.format(
            p1[0],p1[1], p2[0],p2[1], p3[0],p3[1], p4[0],p4[1], colour),
            file=fo)
    print('</svg>', file=fo)
palettes.py:
# Some different colour schemes for our torus.
import random

def rgb_to_html(rgb):
    return '#{:02x}{:02x}{:02x}'.format(*rgb)

pastel_colours = ['#e0bbe4', '#957dad', '#d291bc', '#fec8d8', '#ffdfd3']

elmer_colours = [[68,90,233], [112,0,128], [103,204,33], [217,17,29],
         [228,151,200], [239,240,233], [23,16,16], [242,97,9], [251,236,21]]
for i, rgb in enumerate(elmer_colours):
    elmer_colours[i] = rgb_to_html(rgb)

def depth_shaded(i,idy):
    """Map the ramp i=0->b onto a triangle i=0->1->0."""
    b = len(idy)
    r = b - abs(i - b/2)
    rgb = (int(r/b*255),)*3
    return rgb_to_html(rgb)

colour_funcs = {
    'grey': lambda i, _: '#dddddd',
    'pastels': lambda i, _: random.choice(pastel_colours),
    'elmer': lambda i, _: random.choice(elmer_colours),
    'depth shaded': depth_shaded,
}
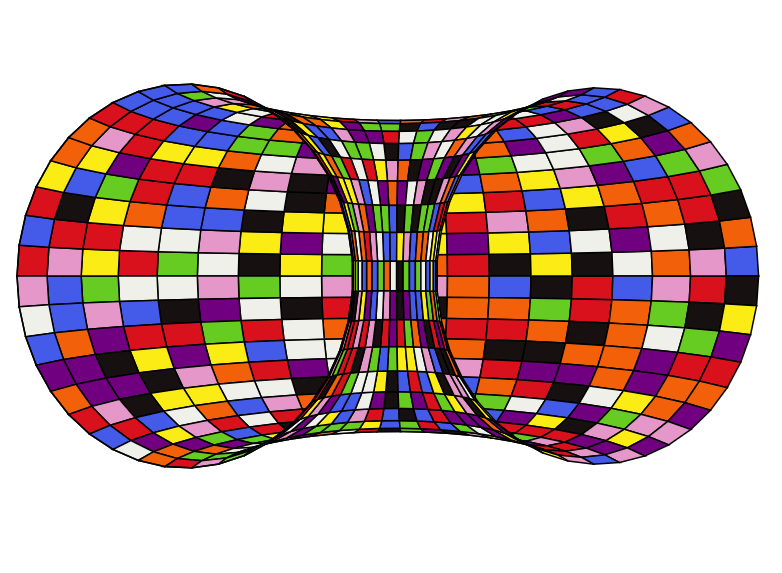
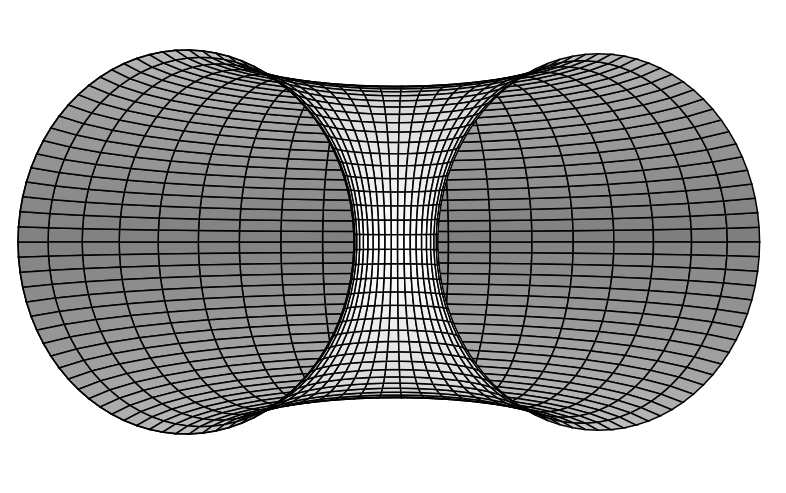
By changing the angular range of the coordinate $\phi$, one can look inside the torus:
Or, in Elmer colours: