The Forest-fire model
Posted on 12 January 2016
A simple model of a forest fire is defined as a two-dimensional cellular automaton on a grid of cells which take one of three states: empty, occupied by a tree, or burning. The automaton evolves according to the following rules which are executed simultaneously for every cell at a given generation.
- A burning cell turns into an empty cell
- A cell occupied by a tree becomes a burning cell if any of its eight neighbouring cells are burning
- A cell occupied by a tree becomes burning with a probabilty $f$ (even if none of its neighbouring cells are burning), as though struck by lightning
- An empty cell becomes occupied by a tree with probability $p$.
The model is interesting as a simple dynamical system displaying self-organized criticality. The following Python code simulates a forest fire using this model for probabilities $p = 0.05$, $f = 0.001$. A Matplotlib animation is used for visualization.
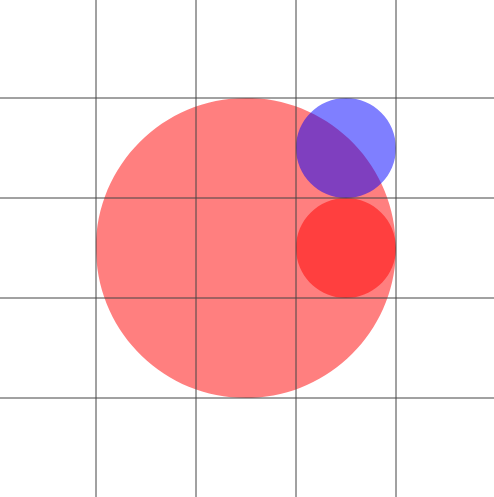
Update (January 2020): As noted by Casey (comment, below), the simulation isn't very realistic for small $f$: fires in a dense forest tend to expand out in a square pattern because diagonally-adjacent trees catch fire as readily as orthogonally-adjacent trees. This can be improved by assigning a probability of less than 1 for these trees to ignite. It isn't obvious what probability to assign, but I use 0.573 below. This is the ratio $B/A$, where $B$ is the area of overlap of a circle of radius $\frac{3}{2}$ at (0,0) (the tree on fire) with one of radius $\frac{1}{2}$ at $(0,\sqrt{2})$ (blue, the diagonally-adjacent tree), and $A$ is the overlap of this first circle with one of radius $\frac{1}{2}$ at $(0,1)$ (red, the orthogonally-adjacent tree). $A$ is equal to the "area" of this adjacent tree, since its circle is contained in the first.
This code is also available on my GitHub page.
import numpy as np
import matplotlib.pyplot as plt
from matplotlib import animation
from matplotlib import colors

# Create a forest fire animation based on a simple cellular automaton model.
# The maths behind this code is described in the scipython blog article
# at https://scipython.com/blog/the-forest-fire-model/
# Christian Hill, January 2016.
# Updated January 2020.

# Displacements from a cell to its eight nearest neighbours
neighbourhood = ((-1,-1), (-1,0), (-1,1), (0,-1), (0, 1), (1,-1), (1,0), (1,1))
EMPTY, TREE, FIRE = 0, 1, 2
# Colours for visualization: brown for EMPTY, dark green for TREE and orange
# for FIRE. Note that for the colormap to work, this list and the bounds list
# must be one larger than the number of different values in the array.
colors_list = [(0.2,0,0), (0,0.5,0), (1,0,0), 'orange']
cmap = colors.ListedColormap(colors_list)
bounds = [0,1,2,3]
norm = colors.BoundaryNorm(bounds, cmap.N)

def iterate(X):
    """Iterate the forest according to the forest-fire rules."""

    # The boundary of the forest is always empty, so only consider cells
    # indexed from 1 to nx-2, 1 to ny-2
    X1 = np.zeros((ny, nx))
    for ix in range(1,nx-1):
        for iy in range(1,ny-1):
            if X[iy,ix] == EMPTY and np.random.random() <= p:
                X1[iy,ix] = TREE
            if X[iy,ix] == TREE:
                X1[iy,ix] = TREE
                for dx,dy in neighbourhood:
                    # The diagonally-adjacent trees are further away, so
                    # only catch fire with a reduced probability:
                    if abs(dx) == abs(dy) and np.random.random() < 0.573:
                        continue
                    if X[iy+dy,ix+dx] == FIRE:
                        X1[iy,ix] = FIRE
                        break
                else:
                    if np.random.random() <= f:
                        X1[iy,ix] = FIRE
    return X1

# The initial fraction of the forest occupied by trees.
forest_fraction = 0.2
# Probability of new tree growth per empty cell, and of lightning strike.
p, f = 0.05, 0.0001
# Forest size (number of cells in x and y directions).
nx, ny = 100, 100
# Initialize the forest grid.
X  = np.zeros((ny, nx))
X[1:ny-1, 1:nx-1] = np.random.randint(0, 2, size=(ny-2, nx-2))
X[1:ny-1, 1:nx-1] = np.random.random(size=(ny-2, nx-2)) < forest_fraction

fig = plt.figure(figsize=(25/3, 6.25))
ax = fig.add_subplot(111)
ax.set_axis_off()
im = ax.imshow(X, cmap=cmap, norm=norm)#, interpolation='nearest')

# The animation function: called to produce a frame for each generation.
def animate(i):
    im.set_data(animate.X)
    animate.X = iterate(animate.X)
# Bind our grid to the identifier X in the animate function's namespace.
animate.X = X

# Interval between frames (ms).
interval = 100
anim = animation.FuncAnimation(fig, animate, interval=interval, frames=200)
plt.show()
Here is a short animation of the forest fire created by this program.