Posted by: christian on 4 Jan 2016
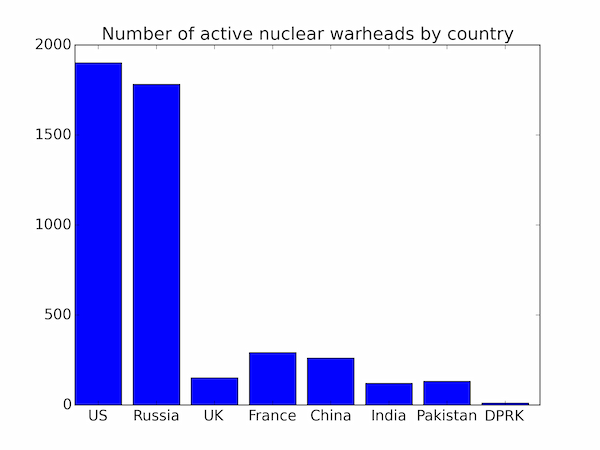
The following program plots a bar chart of the estimated maximum number of active nuclear warheads by country using the default configuration of Matplotlib.
import numpy as np
import matplotlib.pyplot as plt

nuclear_weapons = (('US', 1900),
                   ('Russia', 1780),
                   ('UK', 150),
                   ('France', 290),
                   ('China', 260),
                   ('India', 120),
                   ('Pakistan', 130),
                   ('DPRK', 10))
ix = np.arange(len(nuclear_weapons))
fig, ax = plt.subplots()
width = 0.8
ax.bar(ix, [e[1] for e in nuclear_weapons], width)
ax.set_xticks(ix + width/2)
ax.set_xticklabels([e[0] for e in nuclear_weapons])
ax.set_title('Number of active nuclear warheads by country')
plt.show()
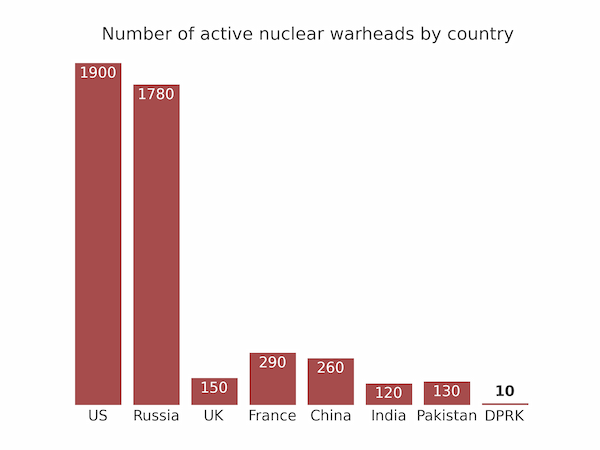
A bit of customization can produce a better-looking plot without too much trouble.
import numpy as np
import matplotlib.pyplot as plt

GREY = (0.2, 0.2, 0.2)
nuclear_weapons = (('US', 1900),
                   ('Russia', 1780),
                   ('UK', 150),
                   ('France', 290),
                   ('China', 260),
                   ('India', 120),
                   ('Pakistan', 130),
                   ('DPRK', 10))
ix = np.arange(len(nuclear_weapons))
fig, ax = plt.subplots(facecolor='w')
width = 0.8
ax.bar(ix, [e[1] for e in nuclear_weapons], width, color='maroon',
       lw=0, alpha=0.7)
ax.set_xticks(ix + width/2)
ax.set_xticklabels([e[0] for e in nuclear_weapons], color=GREY)
for i, e in enumerate(nuclear_weapons):
    count = e[1]
    offset, color, weight = -80, 'w', 'normal'
    if count < 100:
        offset, color, weight = 40, GREY, 'bold'
    plt.text(s=str(count), x=i+width/2, y=count+offset, ha='center',
             color=color, fontweight=weight)
ax.set_frame_on(False)
ax.set_yticks([])
ax.tick_params(axis='x', length=0)
ax.set_title('Number of active nuclear warheads by country', color=GREY)
plt.show()
Comments
Comments are pre-moderated. Please be patient and your comment will appear soon.
There are currently no comments
New Comment