Nuclear binding energies #2
Posted on 14 August 2016
The semi-empirical mass formula parameters used in the previous post were taken from the text book of J. W. Rohlf (1994) [1]. Another, older set of parameters are presented in the compilation of A. H. Wapstra (1958)[2]. Below we compare each with the experimental data from the OECD-NEA (in the file mass.mas03).
This figure is produced by the code below. The SEMF is implemented in the same way as before but now takes the parameters to use as a function argument and automatically sets (presumed invalid) negative binding energies to NaN. The heatmap plots are generated with imshow and use a common colour scale. After plotting them, they are shifted upwards in the figure a little with fig.subplots_adjust to make room for a shared colorbar.
import numpy as np
import pandas as pd
import matplotlib.pyplot as plt
from matplotlib import cm

# SEMF parameters from
# rohlf: J. W. Rohlf, "Modern Physics from alpha to Z0", Wiley (1994)
# wapstra: A. H. Wapstra, "Atomic Masses of Nuclides", Springer (1958)
prms = {'rohlf': (15.75, 17.8, 0.711, 23.7, 11.18),
        'wapstra': (14.1, 13., 0.595, 19., -33.5),
       }

def SEMF(Z, N, prms):
    """Calculate the average binding energy per nucleon for nucleus Z, N.

    Calculate the average nuclear binding energy per nucleon for a nucleus
    with Z protons and N neutrons, using the semi-empirical mass formula and
    parameters given by prms as (aV, aS, aC, aA, delta).

    Z and N can be NumPy arrays or scalar values.

    """

    # The parameterization of the SEMF to use.
    aV, aS, aC, aA, delta = prms

    # Covert Z and N to NumPy arrays if they aren't already
    Z, N = np.atleast_1d(Z), np.atleast_1d(N)
    # Total number of nucleons
    A = Z + N

    # The pairing term is -delta for Z and N both odd, +delta for Z and N both
    # even, and 0 otherwise. Create an array of the sign of this term so that
    # we can vectorize the calculation across the arrays Z and N.
    sgn = np.zeros(Z.shape)
    sgn[(Z%2) & (N%2)] = -1
    sgn[~(Z%2) & ~(N%2)] = +1

    # The SEMF for the average binding energy per nucleon.
    E = (aV - aS / A**(1/3) - aC * Z**2 / A**(4/3) -
         aA * (A-2*Z)**2/A**2 + sgn * delta/A**(3/2))

    # Treat negative binding energies as unphysical and set to NaN
    E[E<0] = np.nan

    # Return E as a scalar or array as appropriate to the input Z.
    if Z.shape[0] == 1:
        return float(E)
    return E

# Make a meshgrid of proton number, neutron number: Z, N
Z = np.linspace(1,200,200, dtype=int)
N = np.linspace(1,200,200, dtype=int)
Z, N = np.meshgrid(Z, N)
avEbind_rohlf = SEMF(Z, N, prms['rohlf'])
avEbind_wapstra = SEMF(Z, N, prms['wapstra'])

#plt.imshow(avEbind, interpolation='none', origin='lower', cmap=cm.hot)

# Read the experimental data into a Pandas DataFrame.
df = pd.read_fwf('mass.mas03', usecols=(2,3,4,11,12),
              names=('N', 'Z', 'A', 'avEbind', 'avEbind_err'),
              widths=(1,3,5,5,5,1,3,4,1,13,11,11,9,1,2,11,9,1,3,1,12,11,1),
              header=39,
              index_col=False)

# Extrapolated values are indicated by '#' in place of the decimal place, so
# the avEbind column won't be numeric. Coerce to float and drop these entries.
df['avEbind'] = pd.to_numeric(df['avEbind'], errors='coerce')
df = df.dropna()
# Also convert from keV to MeV.
df['avEbind'] /= 1000

# Build a 2-D NumPy array from the DataFrame, indexed in the same way as our
# semi-empirical estimates
avEbind = np.empty_like(avEbind_rohlf)
avEbind[:] = np.nan
# NB pesky meshgrid messes with the ordering by default, so indexes are N, Z
avEbind[df['N']-1, df['Z']-1] = df['avEbind']
# Remove entries from the approximation arrays which have no counterparts in
# the experimental data.
avEbind_rohlf[np.isnan(avEbind)] = np.nan
avEbind_wapstra[np.isnan(avEbind)] = np.nan

# We're only interested in (relatively) heavy nuclei, so exclude anything with
# less than Zmin protons or Nmin neutrons. Also set maximum values Zmax, Zmin.
Nmin, Nmax, Zmin, Zmax = 10, 150, 10, 110
avEbind = avEbind[Nmin-1:Nmax,Zmin-1:Zmax]
avEbind_rohlf = avEbind_rohlf[Nmin-1:Nmax,Zmin-1:Zmax]
avEbind_wapstra = avEbind_wapstra[Nmin-1:Nmax,Zmin-1:Zmax]

# Find the absolute values of the differences between experiment and SEMF for
# each model, and the maximum overall difference (any nucleus, any model).
rohlf_err = np.abs(avEbind - avEbind_rohlf)
wapstra_err = np.abs(avEbind - avEbind_wapstra)
vmax = max(np.nanmax(rohlf_err), np.nanmax(wapstra_err))

# Plot two heatmaps with the same colour scale.
fig, axes = plt.subplots(nrows=1,ncols=2)
im1 = axes[0].imshow(rohlf_err, interpolation='nearest', origin='lower',
                     cmap=cm.hot, vmin=0, vmax=vmax)
im2 = axes[1].imshow(wapstra_err, interpolation='nearest', origin='lower',
                     cmap=cm.hot, vmin=0, vmax=vmax)

# Label the axes with proton number (x-axis) and neutron number (y-axis)
for ax in axes:
    ax.set_xticks(range(0, Zmax-Zmin+1, 20))
    ax.set_xticklabels(range(Zmin, Zmax+1, 20))
    ax.set_xlabel(r'$Z$')
    ax.set_yticks(range(0, Nmax-Nmin+1, 20))
    ax.set_yticklabels(range(Nmin, Nmax+1, 20))
    ax.set_ylabel(r'$N$')
axes[0].text(Zmin, Nmax-20, 'Rohlf', fontsize=14)
axes[1].text(Zmin, Nmax-20, 'Wapstra', fontsize=14)

# Adjust the axes upwards to make room for a horizontal colorbar.
fig.subplots_adjust(bottom=0.2)
cbar_ax = fig.add_axes([0.15, 0.05, 0.65, 0.05])
fig.colorbar(im2, cax=cbar_ax, orientation='horizontal')
# Label the colorbar with a text annotation in axes coordinates.
cbar_ax.text(1.02,0.5,r'$\Delta E_\mathrm{bind}\,/\mathrm{MeV}$',
             transform=cbar_ax.transAxes, va='center', fontsize=14)

fig.suptitle('Absolute deviations from experiment for nuclear\nbinding'
             ' energies predicted by two models', fontsize=14)

plt.tight_layout()
plt.savefig('SEMF-deviation.png')
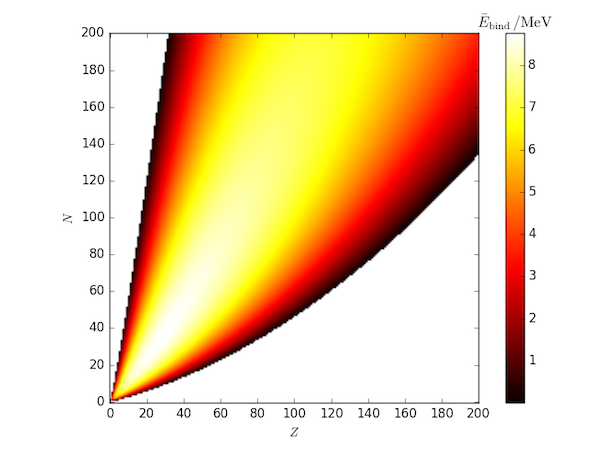
For comparison, here is a heatmap of all average binding energies estimated using the SEMF with the Rohlf paramters.
# Parameters from J. W. Rohlf, "Modern Physics from alpha to Z0", Wiley (1994)
prms = 15.75, 17.8, 0.711, 23.7, 11.18
avEbind_rohlf = SEMF(Z, N, prms)

# Plot a heatmap of average binding energies
fig, ax = plt.subplots()
im = ax.imshow(avEbind_rohlf, origin='lower',
               cmap=cm.hot)
ax.set_xticks(range(0,Zmax+1,20))
ax.set_xlabel(r'$Z$')
ax.set_yticks(range(0,Nmax+1,20))
ax.set_ylabel(r'$N$')
cb = fig.colorbar(im)
# We'd like the colorbar label at the top, so set the title
cb.ax.set_title(r'$\bar{E}_\mathrm{bind}\,/\mathrm{MeV}$')
plt.tight_layout()
plt.savefig('SEMF-plot.png')
plt.show()
References
- J. W. Rohlf, Modern Physics from $\alpha$ to $Z^0$, Wiley (1994).
- A. H. Wapstra, "Atomic Masses of Nuclides", Springer (1958).