Mass Parabolas
Posted on 07 September 2021
An atomic nucleus consists of protons and neutrons (collectively referred to as nucleons) bound together through the strong nuclear force. Models for the nuclear binding energy were introduced in a couple of previous posts on this blog.
The semi-emprical mass formula (SEMF), also known as the liquid drop model is often used to describe the nuclear binding energy. Expressed as a total value for a nucleus of mass number $A$, comprised of $Z$ protons and $N=A-Z$ neutrons, this may be written:
$$ E_\mathrm{bind} = a_VA - a_SA^{2/3} - a_CZ^2A^{-1/3} - a_A(A-2Z)^2A^{-1} \pm\delta A^{-1/2}, $$
where the parameters $a_V$, $a_S$, $a_C$, $a_A$ and $\delta$ are fitted to the experimentally-derived values of $E_\mathrm{bind}$. Their values, in MeV, are given in this previous blog post.
This post addresses the question: for a given mass number, $A$, what is the stability of the various nuclides with different numbers of protons, $Z$? The answer can be inferred from the so-called mass excess: the difference between a nuclide's actual mass and its mass number, expressed in some suitable units (for example, MeV):
$$ M(A,Z)c^2 = Zm_\mathrm{H}c^2 + (A-Z)m_\mathrm{n}c^2 - a_VA + a_SA^{2/3} + a_CZ^2A^{-1/3} + a_A(A-2Z)^2A^{-1} \mp\delta A^{-1/2}, $$
where $m_\mathrm{H} = 1.007825031898 u$ and $m_\mathrm{n} = 1.008644904 u$ are the masses of the hydrogen atom and neutron respectively, and the conversion factor $1 u = 931.49432 \mathrm{MeV}/c^2$ may be used to convert between mass and energy units. The mass excess is an expression of the nuclear binding energy, relative to the binding energy per nucleon of carbon-12 (which defines the atomic mass unit), and therefore can be used to rank the stability of nuclides.
The most stable nuclide with mass number $A$ can be determined by finding the minimum of this expression with respect to $Z$ through solving $\partial M(A,Z)/\partial Z = 0$. It is found that $$ Z_\mathrm{stable} = \frac{4a_A - (m_\mathrm{H} - m_\mathrm{n})c^2}{2A^{-1/3}(a_C + 4a_AA^{-2/3})}. $$
It is possible to compare the mass excesses of all nuclides sharing a common mass number, both from the liquid drop model and from tabulated values, for example those given by G. Audi, A. H. Wapstra and C. Thibault, "The Ame2003 atomic mass evaluation (II)", Nuclear Physics A729, 337–676 (2003), a mixture of experimental data and approximations published by the OECD's Nuclear Energy Agency. The mass excess values are found to lie roughly on a parabola (the mass parabola) with the most stable nuclide at its vertex.
The following Python program reads the tabulated Ame2003 data from mass.mas03 into a pandas DataFrame, and plots the mass parabola for a given $A$ alongside that modeled by the liquid drop expression above.
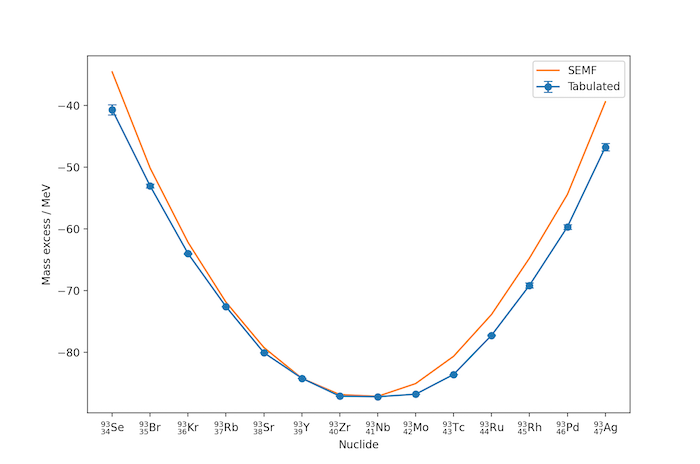
In the example above for $A=93$, niobium, $^{93}_{41}\mathrm{Nb}$, is the most stable nuclide. Nuclides with lower $Z$ decay through beta-emission towards niobium, for example:
$$ \begin{align*} {\,}^{93}_{40}\mathrm{Zr} \rightarrow {\,}^{93}_{41}\mathrm{Nb} + \beta^- + \bar{\nu}_e \end{align*} $$
Those with higher $Z$ undergo positron decay:
$$ ^{93}_{44}\mathrm{Ru} \rightarrow ^{93}_{43}\mathrm{Tc} + \beta^+ + \nu_e $$
or electron capture:
$$ ^{93}_{42}\mathrm{Mo} + e^- \rightarrow ^{93}_{41}\mathrm{Nb} + \nu_e $$
import numpy as np
import pandas as pd
import matplotlib.pyplot as plt

# 1 u = 931.49432 MeV/c2
f = 931.49432
# Hydrogen atom mass (MeV)
mH = 1.007825031898 * f
# Neutron mass (MeV)
mn = 1.008644904 * f

# Liquid drop model parameters, MeV: volume, surface and pairing terms.
aV, aS, delta = 15.75, 17.8, 11.18
# Liquid drop model parameters, MeV: asymmetry term (aA) and Coulomb term (aC).
aA, aC = 23.7, 0.711

def get_SEMF_mass_excess(A, Z):
    """Return the mass excess calculated using the SEMF model."""

    # The pairing term is -delta for Z and N both odd, +delta for Z and N both
    # even, and 0 otherwise. Create an array of the sign of this term so that
    # we can vectorize the calculation across the arrays Z and N.
    N = A - Z
    sgn = np.zeros(Z.shape)
    sgn[(Z%2) & (N%2)] = -1
    sgn[~(Z%2) & ~(N%2)] = +1

    # The SEMF for the binding energy.
    E = (aV*A - aS * A**(2/3) - aC * Z**2 / A**(1/3) -
         aA * (A-2*Z)**2 / A + sgn * delta / A**(1/2))

    mass_excess = Z*mH + (A-Z)*mn - A*f - E
    return mass_excess


def most_stable_Z(A):
    """Return the predicted most stable atomic number for mass number A."""
    Z = (4*aA - (mH - mn)) / (2*A**(-1/3) * (aC + 4*aA*A**(-2/3)))
    return round(Z)


# Estimated mass excesses are indicated with a '#' symbol after the numeric
# value. Drop the '#' and coerce to float, in MeV (not keV!)
strip_hash_and_keV_to_MeV = lambda s: float(s.replace('#','')) / 1000
# Read the experimental data into a Pandas DataFrame.
df = pd.read_fwf('mass.mas03', usecols=(2, 3, 4, 6, 9, 10),
              names=('N', 'Z', 'A', 'symbol', 'mass_excess', 'mass_excess_unc',
                    ),
              converters={'symbol': str,
                          'mass_excess': strip_hash_and_keV_to_MeV,
                          'mass_excess_unc': strip_hash_and_keV_to_MeV},
              widths=(1,3,5,5,5,1,3,4,1,13,11,11,9,1,2,11,9,1,3,1,12,11,1),
              header=39,
              index_col=False)


def get_dfA(A):
    """Return a DataFrame just for mass number A."""
    dfA = df[df['A']==A]
    return dfA

def plot_mass_parabola(A):
    dfA = get_dfA(A)
    fig, ax = plt.subplots()
    ax.errorbar(dfA['Z'], dfA['mass_excess'], dfA['mass_excess_unc'],
                marker='o', capsize=4, label='Tabulated')
    SEMF_mass_excess = get_SEMF_mass_excess(A, dfA['Z'])
    ax.plot(dfA['Z'], SEMF_mass_excess, c='tab:orange', label='SEMF')
    ax.set_xticks(dfA['Z'])
    xticklabels = [r'${}_{' + str(Z) + r'}' + r'^{' + str(A) + '}\mathrm{'
                    + symbol + '}$' for Z, symbol in zip(dfA['Z'],
                                                         dfA['symbol'])]
    ax.set_xticklabels(xticklabels)
    ax.set_xlabel('Nuclide')
    ax.set_ylabel('Mass excess / MeV')
    ax.legend()
    plt.show()

A = 93
stable_Z = most_stable_Z(A)
stable_symbol = df[(df['A']==A) & (df['Z']==stable_Z)].iloc[0]['symbol']
print(f'A = {A}')
print(f'Predicted most stable Z = {stable_Z} ({stable_symbol})')
plot_mass_parabola(A)