Matching coloured LED combinations to a spectrum
Posted on 26 December 2020
A previous blog post provides a class, ColourSystem, which can be used to predict the colour (within some colour system) of a provided spectrum. This post uses the class to determine how to combine a number of light emitting diodes (LEDs), or other light sources with known spectra in order to produce light with a given spectrum. This task is not as simple as fitting a linear combination of the LED spectra to the given spectrum because the colour matching functions determining the tristimulus values (which, in turn model the colour perceived by the human eye) vary with wavelength and overlap. Also, LEDs emit light, so no negative coefficient in such a linear combination can be allowed.
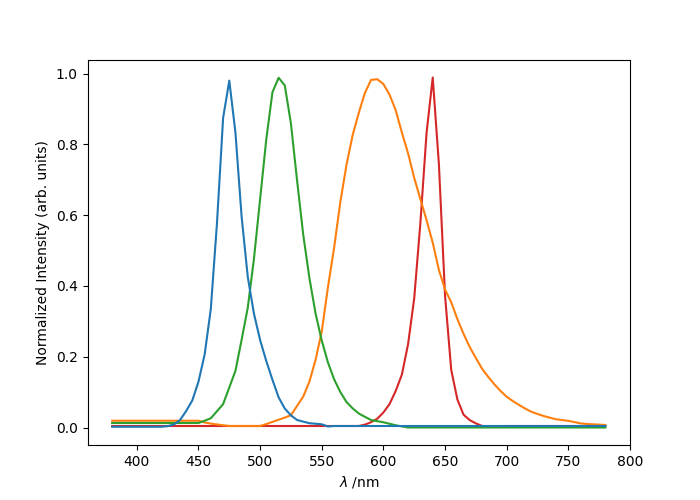
The utility functions below (led_fit.py) read in the spectra for each LED from the data files led-red.csv, led-orange.csv, led-green.csv and led-blue.csv, and use an instance of the ColourSystem class defined here to convert between spectra, normalized chromaticity ($(x, y)$ coordinates) and HTML colour strings.
The LED spectra used are plotted below.
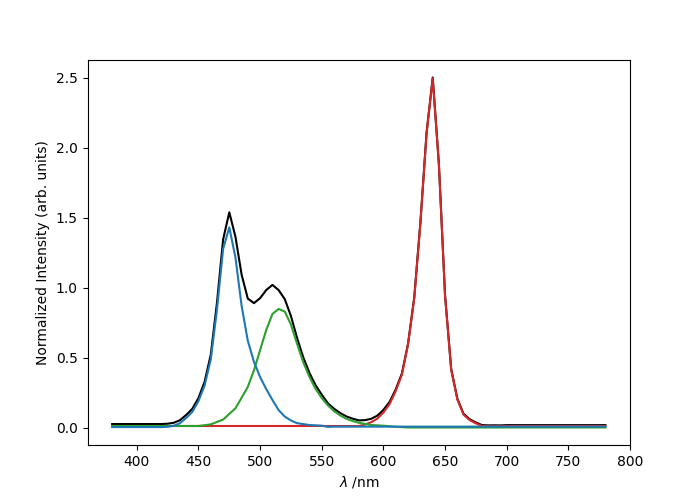
Approximating white light with three LEDs
The following code fits coefficients for a particular type of red, green and blue LED to approximate the chromaticity coordinates of the CIE Standard Illuminant D65. The total LED spectrum, as plotted by the code, is shown below.
The output is:
[0.31266048 0.32906744] approximates (0.3127, 0.3291)
with the following coefficients of ['red', 'green', 'blue']
[0.51530624 0.47649352 0.23179431]
HTML code for target colour: #fefeff
HTML code for fitted colour: #fefeff
That is, presumably two red, two green and one blue LEDs of this kind would make a reasonably good approximation to white light.
import numpy as np
import matplotlib.pyplot as plt
from colour_system import cs_hdtv as cs, xyz_from_xy
from led_fit import lam, fit_led_xy, get_led_data, get_led_spec

led_colours=['red', 'green', 'blue']

# Target chromaticity coordinates: Illuminant D65
B_xy = 0.3127, 0.3291
fit_coeffs, led_spec = fit_led_xy(B_xy, True, cs, led_colours)
print(cs.spec_to_xyz(led_spec)[:2], 'approximates', B_xy)
print('with the following coefficients of', led_colours)
print(fit_coeffs)

# Get HTML codes for the target and fitted colours.
led_html = cs.spec_to_rgb(led_spec, out_fmt='html')
B_html = cs.rgb_to_hex(cs.xyz_to_rgb(xyz_from_xy(*B_xy)))
print('HTML code for target colour:', B_html)
print('HTML code for fitted colour:', led_html)

# Plot the total LED spectrum and its component intensities.
fig, ax = plt.subplots()
ax.plot(lam, led_spec, 'k')
Iled = get_led_data(led_colours)
ax.plot(lam, fit_coeffs[0] * Iled[0], c='tab:red')
ax.plot(lam, fit_coeffs[1] * Iled[1], c='tab:green')
ax.plot(lam, fit_coeffs[2] * Iled[2], c='tab:blue')
ax.set_xlabel('$\lambda\;/\mathrm{nm}$')
ax.set_ylabel('Normalized Intensity (arb. units)')
plt.show()
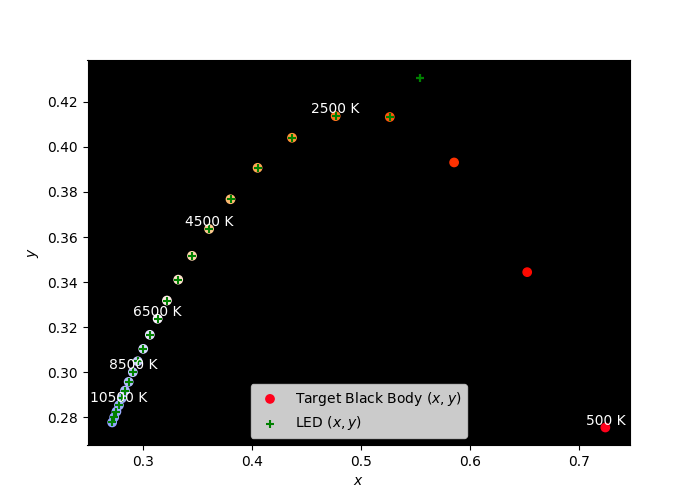
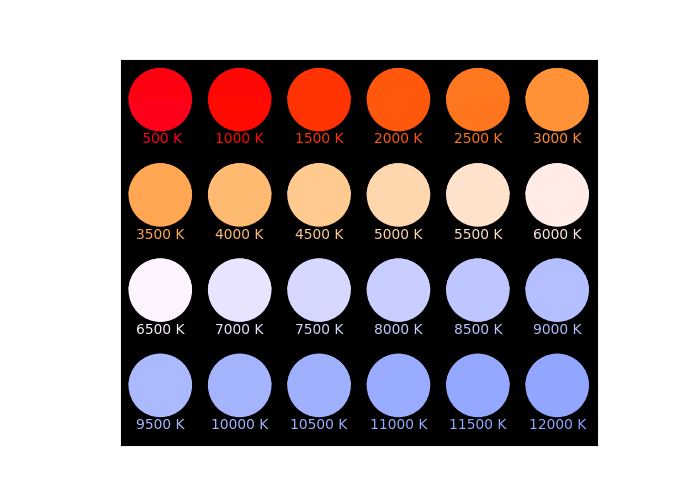
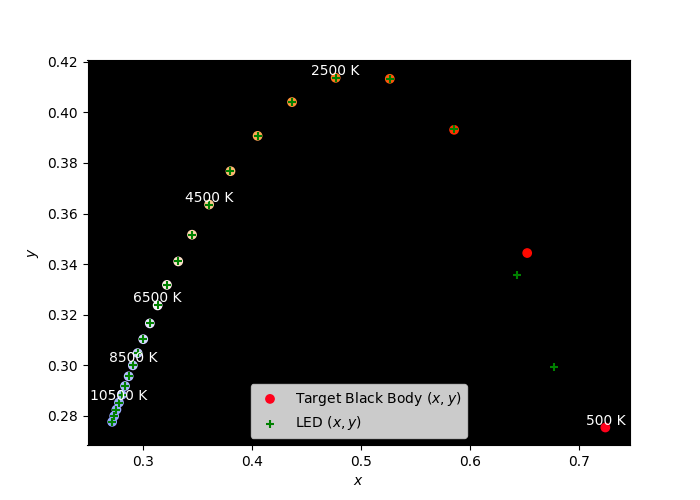
Approximating star colours with LEDs
The code below fits the spectra of a specified list of LEDs to the match the colours of stars of different temperatures deduced from their black body spectra. In the plots, the top half of each circle is the LED approximation, the lower half is the black body colour. Also plotted are the black body and combined LED $(x,y)$ chromaticities. Using only orange, green and blue LEDs does a pretty good job apart from the lower-$T$, red stars:
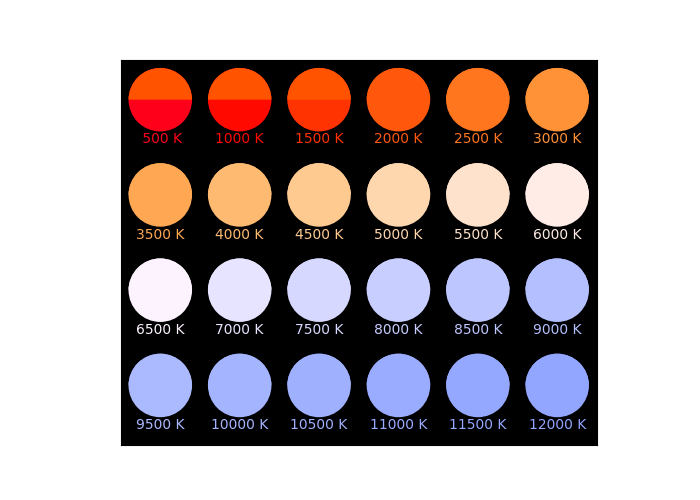
Using red, orange, green and blue together gives a pretty faithful approximation:
import numpy as np
from scipy.constants import h, c, k
import matplotlib.pyplot as plt
from matplotlib.patches import Circle, Wedge
from colour_system import cs_hdtv as cs
from led_fit import lam, fit_led_xy

def planck(lam, T):
    """Returns the spectral radiance of a black body at temperature T.

    Returns the spectral radiance, B(lam, T), in W.sr-1.m-2 of a black body
    at temperature T (in K) at a wavelength lam (in nm), using Planck's law.

    """

    lam_m = lam / 1.e9
    fac = h*c/lam_m/k/T
    B = 2*h*c**2/lam_m**5 / (np.exp(fac) - 1)
    return B

fig, ax = plt.subplots()

# Keep track of the chromaticity coordinates and HTML colours.
led_xy = []
B_xy = []
B_html = []
for i in range(24):
    # T = 500 to 12000 K
    T = 500*i + 500

    # Calculate the black body spectrum and the HTML hex RGB colour string
    # it looks like
    B = planck(lam, T)
    B /= np.max(B)
    fit_coeffs, led_spec = fit_led_xy(B, led_colours=['red', 'orange', 'green', 'blue'])
    print(fit_coeffs)

    led_html = cs.spec_to_rgb(led_spec, out_fmt='html')
    B_html.append(cs.spec_to_rgb(B, out_fmt='html'))
    led_xy.append(cs.spec_to_xyz(led_spec)[:2])
    B_xy.append(cs.spec_to_xyz(B)[:2])

    # Place and label a circle with the colour of a black body at temperature T
    x, y = i % 6, -(i // 6)
    circle = Circle(xy=(x, y*1.2), radius=0.4, fc=B_html[-1])
    ax.add_patch(circle)
    # Place and label an overlapping semicircle in the LED colour.
    wedge = Wedge((x, y*1.2), 0.4, 0, 180, fc=led_html)
    ax.add_patch(wedge)
    ax.annotate('{:4d} K'.format(T), xy=(x, y*1.2-0.5), va='center',
                ha='center', color=B_html[-1])

# Set the limits and background colour; remove the ticks
ax.set_xlim(-0.5,5.5)
ax.set_ylim(-4.35, 0.5)
ax.set_xticks([])
ax.set_yticks([])
ax.set_facecolor('k')
# Make sure our circles are circular!
ax.set_aspect("equal")
plt.show()

fig, ax = plt.subplots()
ax.set_facecolor('k')
Tgrid = [500*i + 500 for i in range(24)]
ax.scatter(*zip(*B_xy), c=B_html, label='Target Black Body $(x,y)$')
ax.scatter(*zip(*led_xy), label='LED $(x, y)$', marker='+', c='g')
for i in range(0, 24, 4):
    T = Tgrid[i]
    ax.text(B_xy[i][0], B_xy[i][1], '{} K'.format(T), ha='center',
            va='bottom', color='w')
ax.set_xlabel(r'$x$')
ax.set_ylabel(r'$y$')
ax.legend(loc='lower center')
plt.show()
Here is the led_fit.py program, with utilities used by the above code:
import sys
import numpy as np
from scipy.optimize import minimize
from colour_system import cs_hdtv

# These are the LEDs for which we have spectral and power data.
all_led_colours = 'red', 'orange', 'green', 'blue'
Pled = {'red': 4.9, 'orange': 1.5, 'green': 1.8, 'blue': 6.3}

# The grid of visible wavelengths corresponding to the grid of colour-matching
# functions used by the ColourSystem instance.
lam = np.arange(380., 781., 5)

def get_led_spectrum_data(filename, lam):
    """Get an LED spectrum from its filename.

    Read in the LED spectrum and interpolate onto wavelengths grid, lam.

    """

    wv, I = [], []
    with open(filename) as fi:
        for line in fi:
            fields = line.split(',')
            wv.append(float(fields[0]))
            I.append(float(fields[1]))

    return np.interp(lam, wv, I)


def get_led_data(led_colours):
    """Get LED and power data for LEDs identified by the provided list."""
    ncolours = len(led_colours)

    # Read in the LED spectra and calculate the LED intensities by weighting
    # with their powers.
    Iled = np.empty((ncolours, lam.shape[0]))
    # LED radiative powers
    for i, led_colour in enumerate(led_colours):
        filename = 'led-{}.csv'.format(led_colour)
        Iled[i] = Pled[led_colour] * get_led_spectrum_data(filename, lam)
    return Iled

def get_led_spec(coeffs, Iled):
    """Calculate an LED spectrum from coefficients to its colour components."""
    return (coeffs * Iled.T).sum(axis=1)

def fit_led_spec(B, Iled):
    """Fit the spectrum B to a linear combination of the LED spectra."""
    A = Iled.T
    coeffs = np.linalg.lstsq(A, B, rcond=None)[0]
    return coeffs, get_led_spec(coeffs, Iled)


def fit_led_xy(B, xy=False, cs=cs_hdtv, led_colours=all_led_colours):
    """
    Find the best linear combination of LED weights to best approximate
    the chromaticity coordinates of a provided spectrum, B. If xy is True,
    these coordinates are passed directly; otherwise deduce them from B and
    the colour matching function.

    """

    # The fit is constrained so that the coefficients are positive.
    ncolours = len(led_colours)

    Iled = get_led_data(led_colours)

    B_xy = B
    if not xy:
        B_xy = cs.spec_to_xyz(B)[:2]

    def minfunc(coeffs):
        """The function to minimize in optimizing the LED colour.

        Create the spectrum as a linear combination of the LED spectra,
        weighted by coeffs, and then return the difference between its
        chromaticity coordinates and the target chromaticity, B_xy.

        Returns the best fit coefficients and the resulting LED spectrum.

        """

        led_spec = get_led_spec(coeffs, Iled)
        led_xy = cs.spec_to_xyz(led_spec)[:2]
        return np.sqrt((B_xy[0]-led_xy[0])**2 + (B_xy[1]-led_xy[1])**2)

    # Optimize the LED spectrum by finding the coefficients which give the
    # closest approximation to the chromaticity coordinates of the target
    # spectrum.
    if not xy:
        # For an initial guess, take the coefficients obtained by a
        # linear, least-squares fit to the target spectrum, if available.
        coeffs, _ = fit_led_spec(B, Iled)
        # Don't allow any negative coefficients.
        coeffs = coeffs.clip(0, None)
    else:
        # Otherwise, just set equal coefficients initially.
        coeffs = np.ones(ncolours) / ncolours
    #print('Initial guess coeffs =', coeffs)

    # NB Late-binding of closures: force the lambdas to take the desired i.
    cons = [{'type': 'ineq',
             'fun': lambda X, i=i: X[i]} for i in range(ncolours)]
    # Add this constraint to prevent pathological fits with all coefficients
    # close to zero:
    cons.append({'type': 'ineq', 'fun': lambda X: np.sum(X)-0.5})
    res = minimize(minfunc, coeffs, constraints=cons, method='COBYLA')
    if not res.success:
        print('Optimization did not suceed. Sorry.')
        sys.exit(1)

    fit_coeffs = res.x
    #print(fit_coeffs)

    led_spec = get_led_spec(fit_coeffs, Iled)
    return fit_coeffs, led_spec