Posted by: christian on 21 Apr 2020
STATISTICS AUSTRIA provides economic and demographic statistical services to the state of Austria. This page lists the Consumer Price Index it calculates every month according to a methodology that is updated every five years.
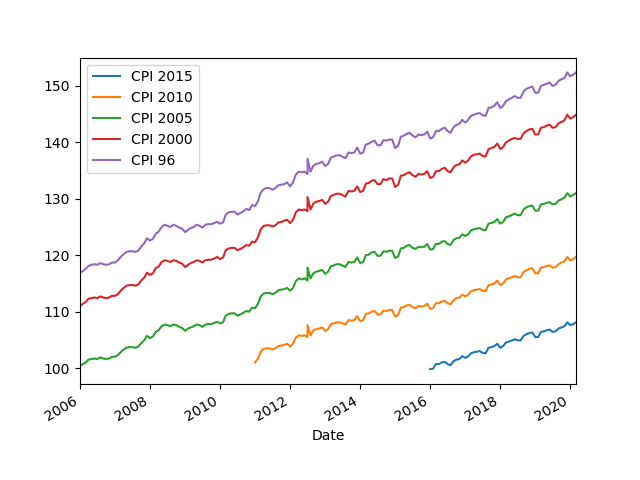
The script below reads data from this page into a pandas DataFrame, cleans and processes it a little, and plots the various measures of CPI in the following figure.
Note that the website uses a comma as a decimal separator, which can be specified in the call to pd.read_html.
import pandas as pd
import matplotlib.pyplot as plt

# Read in a DataFrame from the appropriate table on this webpage.
url = ('http://www.statistik.at/web_en/statistics/Economy/Prices/'
       'consumer_price_index_cpi_hcpi/028929.html')
h = pd.read_html(url, decimal=',', thousands='.')
df = h[0]

# Remove rows corresponding to the yearly average interest rate.
df = df[~df['Month / Year'].str.contains('Ø')]
# Drop the last row, which doesn't contain data.
df = df[:-1]

# Set the index using the relevant column.
df.index = pd.DatetimeIndex(df['Month / Year'], name='Date')
df =df.drop('Month / Year', axis=1)

# Ensure the remaining columns are numeric.
df = df[df.columns].astype(float)

# Plot only the CPI columns (not the "Inflation rate%" column.
df.iloc[:, 1:].plot()
plt.show()
Comments
Comments are pre-moderated. Please be patient and your comment will appear soon.
Paco 4 years ago
Thank you for publishing so varied examples. Not a comment actually to this entry of your blog...
Link | Replychristian 4 years ago
That's very nice of you – thank you!
Link | ReplyNew Comment