Posted by: christian on 10 May 2017
In 2016 it seemed that Cambridge, UK was unusually cold. News reports this year have suggested that April 2017 has been unusually dry. To determine to what extent this is true (again, in Cambridge), I downloaded the monthly weather summaries from the Cambridge University Digital Technology Group. This is easily done using a few lines of bash:
for i in {1995..2016}; do
    curl https://www.cl.cam.ac.uk/research/dtg/weather/period-text.cgi?$i-04 >$i-04.csv;
done
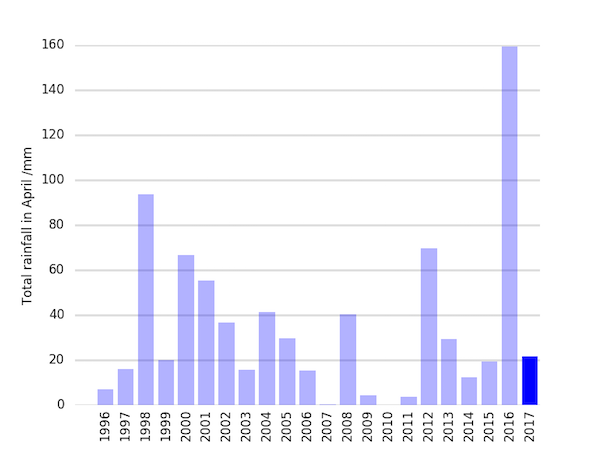
The following Python script analyses these files and plots a bar chart of the total rainfall for April over the last 20 years or so in Cambridge. It also calculates the mean (34.4 mm) and standard deviation (36.3 mm) rainfall. 2017's total (21.7 mm) is less than the mean but well within one standard deviation and, in fact, greater than the rainfall over 5 of the last 10 years), so this year is not particularly remarkable, at least at this location.
import numpy as np
import matplotlib.pyplot as plt

LIGHT_GREY = '#dddddd'

YEAR_MIN, YEAR_MAX = 1995, 2017

def get_rainfall(year):
    filename = '{}-04.csv'.format(year)
    with open(filename) as fi:
        for line in fi:
            if line.startswith('Total Rainfall mm'):
                break
        else:
            print('Skipping {}: no rainfall reported'.format(filename))
            return None

        rainfall = float(fi.readline())
        return rainfall

nyears = YEAR_MAX - YEAR_MIN + 1
years = []
rainfalls = {}
for year in range(YEAR_MIN, YEAR_MAX+1):
    rainfall = get_rainfall(year)
    if rainfall is not None:
        years.append(year)
        rainfalls[year] = rainfall

print('mean: {:.2f} mm'.format(np.mean(list(rainfalls.values()))))
print('std: {:.2f} mm'.format(np.std(list(rainfalls.values()))))

fig, ax = plt.subplots(facecolor='w')
bars = ax.bar(years, [rainfalls[year] for year in years], align='center',
              alpha=0.3, ec='none')
bars[-1].set_alpha(1)

# Tidy up the plot with some nice styles.
ax.set_xticks(years)
ax.set_xlim(YEAR_MIN-0.5, YEAR_MAX+0.5)
ax.set_ylabel('Total rainfall in April /mm')
for tick in ax.get_xticklabels():
    tick.set_rotation(90)
for spine_pos in ('top', 'right', 'bottom', 'left'):
    ax.spines[spine_pos].set_visible(False)
ax.xaxis.set_ticks_position('none')
ax.yaxis.set_ticks_position('none')
ax.yaxis.set_tick_params(pad=10)
ax.yaxis.grid(which='major', c=LIGHT_GREY, lw=2, ls='-')
ax.set_axisbelow(True)

plt.show()
Comments
Comments are pre-moderated. Please be patient and your comment will appear soon.
There are currently no comments
New Comment