Breeding tritium for a fusion reactor
Posted on 09 January 2019
The most feasible nuclear reaction for a "first-generation" fusion reaction is the one involving deuterium (D) and tritium (T): $$ \mathrm{D} + \mathrm{T} \rightarrow \alpha (3.5\;\mathrm{MeV}) + n (14.1\;\mathrm{MeV}) $$ Tritium is not a primary fuel and does not exist in significant quantities naturally since it decays with a half life of 12.3 years. It therefore has to be "bred" from a separate nuclear reaction. Most fusion reactor design concepts employ a lithium "blanket" surrounding the reaction vessel which absorbs the energetic fusion neutrons to produce tritium in such a reaction.
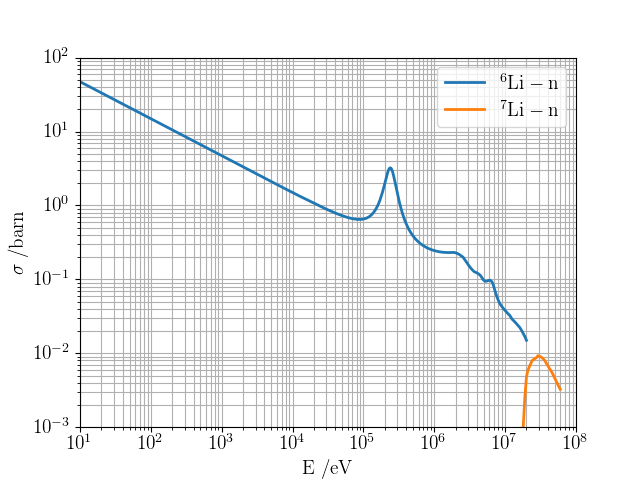
There are two stable isotopes of lithium, $\mathrm{^6Li}$ (7.59 % abundance) and $\mathrm{^7Li}$ (92.41 %). Both absorb neutrons to produce tritium:
$$ \begin{align*} \mathrm{^6Li} + \mathrm{n} & \rightarrow \mathrm{T} + \alpha + 4.8\;\mathrm{MeV}\ \mathrm{^7Li} + \mathrm{n} & \rightarrow \mathrm{T} + \alpha + \mathrm{n} - 2.466\;\mathrm{MeV} \end{align*} $$
Unfortunately, only the reaction with the less-abundant isotope has a significant cross section for thermal neutrons, and even then a neutron multiplier is required because of unavoidable neutron losses and incomplete geometric coverage of the blanket (endothermic nuclear reactions involving $\mathrm{^9Be}$ or $\mathrm{Pb}$ have been suggested). Enrichment of lithium is currently a messy and expensive activity involving large quantities of mercury: a viable method will need to be developed before a nuclear fusion reactor can become a reality.
The following code uses the ENDF data files Li-6(n,T)He-4.endf and Li-7(n,n+T)He-4.endf to plot the cross sections for the above reactions.
import numpy as np
from matplotlib import rc
import matplotlib.pyplot as plt
rc('font', **{'family': 'serif', 'serif': ['Computer Modern'], 'size': 14})
rc('text', usetex=True)

def read_xsec(filename):
    """Read in the energy grid and cross section from filename."""

    E, xs = np.genfromtxt(filename, comments='#', unpack=True, usecols=(0,1))
    return E, xs

# Read in the data files:
# 6Li + n -> T + 4He + 4.8 MeV
E_Li6, Li6_xs = read_xsec('Li-6(n,T)He-4.endf')
# 7Li + n -> T + 4HE + n' - 2.466 MeV
E_Li7, Li7_xs = read_xsec('Li-7(n,n+T)He-4.endf')

fig, ax = plt.subplots()
ax.loglog(E_Li6, Li6_xs, lw=2, label='$\mathrm{^6Li-n}$')
ax.loglog(E_Li7, Li7_xs, lw=2, label='$\mathrm{^7Li-n}$')

# Prettify, set the axis limits and labels
ax.grid(True, which='both', ls='-')
ax.set_xlim(10, 1.e8)
ax.set_xlabel('E /eV')
ax.set_ylim(0.001, 100)
ax.set_ylabel('$\sigma\;/\mathrm{barn}$')

ax.legend()
plt.savefig('lithium-xsecs.png')
plt.show()