Plotting nuclear fusion cross sections
Posted on 10 July 2018
In a nuclear fusion reaction two atomic nuclei combine to form a single nucleus of lower total mass, the difference in mass, $\Delta m$ being released as energy in accordance with $E = \Delta m c^2$. It is this process which powers stars (in our own sun, hydrogen nuclei are fused into helium), and nuclear fusion has been actively pursued as a potential clean and cheap energy source in reactors on Earth for over 50 years.
In deciding which nuclei should be the "fuel" in a nuclear fusion reactor, an important quantity is the "cross section", $\sigma$, a measure of the reaction probability as a function of the kinetic energy of the reactant nuclei. The nuclei are positively-charged and so repel each other (Coulomb repulsion): fusion is only possible if they are able to overcome this repulsion to approach each other at close range. This, in turn, demands that they have a large relative speed and hence kinetic energy. For a viable fusion reactor on Earth, this corresponds to a temperature of many millions of Kelvin.
The IAEA's Nuclear Data Section provides a database of evaluated nuclear data, ENDF, that can be used to illustrate the fusion cross section. The code below uses data from ENDF to plot the fusion cross section for three fusion reactions:
$$ \begin{align*} \mathrm{D} + \mathrm{T} & \rightarrow \alpha (3.5\;\mathrm{MeV}) + n (14.1\;\mathrm{MeV})\\ \mathrm{D} + \mathrm{D} & \rightarrow \mathrm{T} (1.01\;\mathrm{MeV}) + p^+(3.02\;\mathrm{MeV})\\ & \rightarrow \mathrm{^3He} (0.82\;\mathrm{MeV}) + n(2.45\;\mathrm{MeV})\\ \mathrm{D} + \mathrm{^3He} & \rightarrow \alpha (3.6\;\mathrm{MeV}) + p^+(14.7\;\mathrm{MeV}) \end{align*} $$
where the D + D reaction has two possible channels with approximately equal probability of occuring; the orange line below depicts the total cross section for both processes.
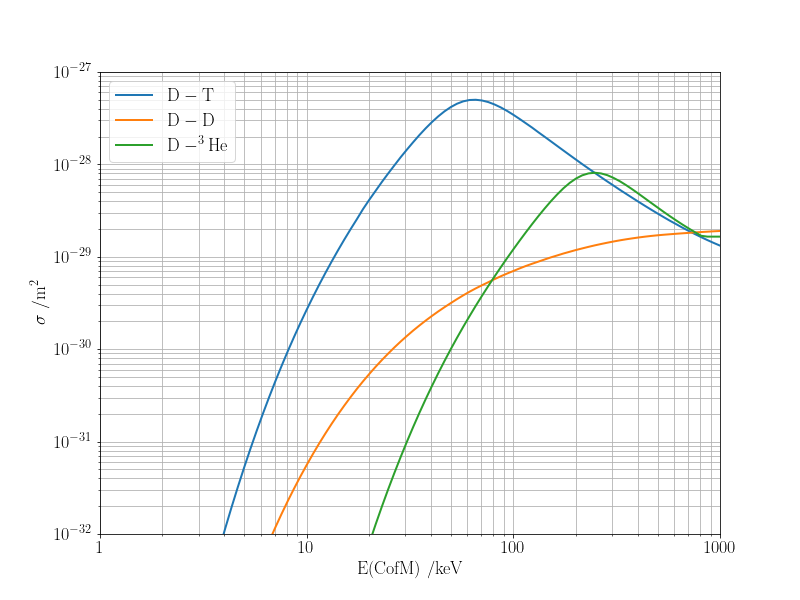
The reason that the majority of research on experimental fusion reactors has focused on the D + T process is that it has the largest cross section, which peaks at the lowest temperature. This means that the plasma in which fusion occurs does not have to be heated as much: indeed, ITER aims to operate at 150 million K. The 17.6 MeV released in the D + T reaction corresponds to an energy release many times greater than a typical chemical reaction (the combustion of octane releases only 57 eV, which is more than 300,000 times less energy).
The code below requires the following data files:
A small detail arises in the transformation of energy from the "lab-fixed" frame of the ENDF format (in which the heavier, target, reactant is assumed to be stationary) to a frame moving with the centre-of-mass of the system. This is handled in the function which reads in the cross section files if the constant COFM is set to True. The cross sections provided by ENDF are not all on the same energy grid, so they are also interpolated onto a common grid by this function.
import numpy as np
from matplotlib import rc
import matplotlib.pyplot as plt
from scipy.constants import e, k as kB
rc('font', **{'family': 'serif', 'serif': ['Computer Modern'], 'size': 14})
rc('text', usetex=True)

# To plot using centre-of-mass energies instead of lab-fixed energies, set True
COFM = True

# Reactant masses in atomic mass units (u).
masses = {'D': 2.014, 'T': 3.016, '3He': 3.016}

# Energy grid, 1 – 1000 keV, evenly spaced in log-space.
Egrid = np.logspace(0, 3, 100)

def read_xsec(filename):
    """Read in cross section from filename and interpolate to energy grid."""

    E, xs = np.genfromtxt(filename, comments='#', skip_footer=2, unpack=True)
    if COFM:
        collider, target = filename.split('_')[:2]
        m1, m2 = masses[target], masses[collider]
        E *= m1 / (m1 + m2)

    xs = np.interp(Egrid, E*1.e3, xs*1.e-28)
    return xs

# D + T -> α + n
DT_xs = read_xsec('D_T_-_a_n.txt')

# D + D -> T + p
DDa_xs = read_xsec('D_D_-_T_p.txt')
# D + D -> 3He + n
DDb_xs = read_xsec('D_D_-_3He_n.txt')
# Total D + D fusion cross section is due to equal contributions from the
# above two processes.
DD_xs = DDa_xs + DDb_xs

# D + 3He -> α + p
DHe_xs = read_xsec('D_3He_-_4He_p.txt')

fig, ax = plt.subplots()
ax.loglog(Egrid, DT_xs, lw=2, label='$\mathrm{D-T}$')
ax.loglog(Egrid, DD_xs, lw=2, label='$\mathrm{D-D}$')
ax.loglog(Egrid, DHe_xs, lw=2, label='$\mathrm{D-^3He}$')
ax.grid(True, which='both', ls='-')
ax.set_xlim(1, 1000)
xticks= np.array([1, 10, 100, 1000])
ax.set_xticks(xticks)
ax.set_xticklabels([str(x) for x in xticks])

if COFM:
    xlabel ='E(CofM) /keV'
else:
    xlabel ='E /keV'
ax.set_xlabel(xlabel)

ax.set_ylabel('$\sigma\;/\mathrm{m^2}$')
ax.set_ylim(1.e-32, 1.e-27)

ax.legend()
plt.savefig('fusion-xsecs.png')
plt.show()