Bertrand's Paradox
Posted on 17 April 2018
Bertrand's Paradox is an illustration of the need to define the mechanism for picking a random variable carefully for its associated probability to be well-defined.
Consider an equilateral triangle inscribed in a circle. What is the probability that a randomly-chosen chord of the circle is longer than the side-length of the triangle?
It turns out that the answer depends on how the randomly-chosen chord is selected. There are (at least) three reasonable ways to choose a chord randomly, briefly outlined below (see the Wikipedia article for more details).
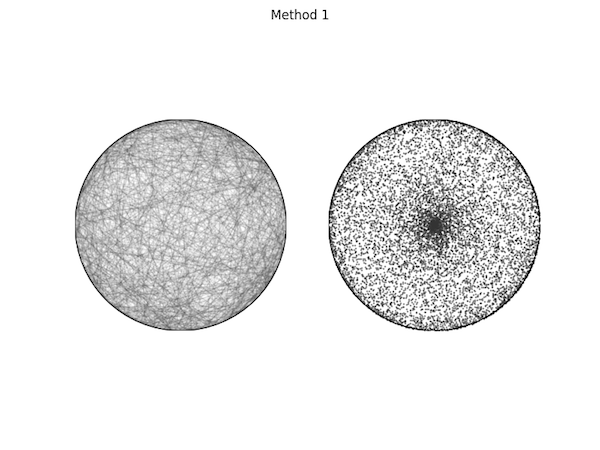
Method 1. (Random endpoints) Pick two random points on the circumference of the circle and join them with a straight line. The probability that the chord thus formed is longer than the side of the triangle is then $\frac{1}{3}$.
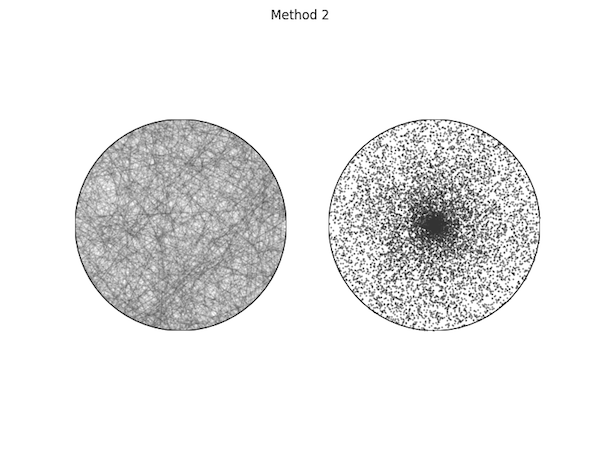
Method 2. (Random radius) Pick a random radius of the circle and then a random point on the radius. Construct the unique chord through the point, perpendicular to the radius. In this case, the probability that the chord is longer than the triangle side length is $\frac{1}{2}$.
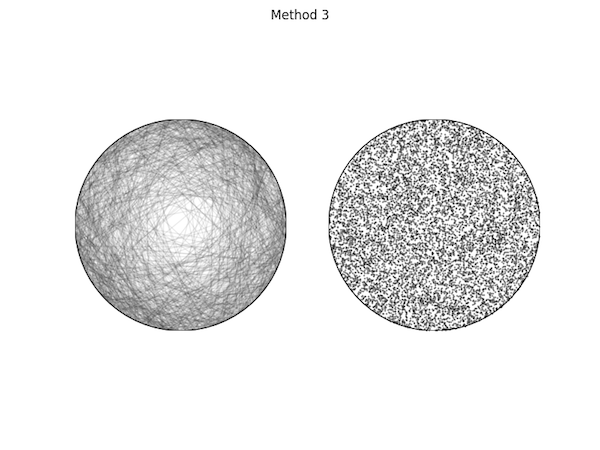
Method 3. (Random midpoint) Pick a point inside the circle at random and take this to be the midpoint of the chord perpendicular to the radius containing it. The probability that this chord is longer than the triangle side length is then $\frac{1}{4}$.
The code below visualizes a random selection of chords (lefthand side) and their midpoints (righthand side) chosen according to each of these methods and verifies the probabilities given above.
Typical output:
Bertrand, method 1 probability: 0.3328
Bertrand, method 2 probability: 0.5053
Bertrand, method 3 probability: 0.2506
This code is also available on my Github page.
import numpy as np
import matplotlib.pyplot as plt
from matplotlib.patches import Circle
from matplotlib.lines import Line2D

TAU = 2 * np.pi

# Fractional RGB values for light grey.
GREY = (0.2,0.2,0.2)
# Don't plot more than this number of chords because they overlap too much
# and obscure the point we're trying to make.
NCHORDS_TO_PLOT = 1000
# Do the statistics using a sample size of nchords
nchords = 10000
# The circle radius. Doesn't matter what it is.
r = 1
# The critical side length of the equilateral triangle inscribed in the circle.
# We are testing if a chord is longer than this length.
tlen = r * np.sqrt(3)

def setup_axes():
    """Set up the two Axes with the circle and correct limits, aspect."""

    fig, axes = plt.subplots(nrows=1, ncols=2, subplot_kw={'aspect': 'equal'})
    for ax in axes:
        circle = Circle((0,0), r, facecolor='none')
        ax.add_artist(circle)
        ax.set_xlim((-r,r))
        ax.set_ylim((-r,r))
        ax.axis('off')
    return fig, axes

def bertrand1():
    """Generate random chords and midpoints using "Method 1".

    Pairs of (uniformly-distributed) random points on the unit circle are
    selected and joined as chords.

    """

    angles = np.random.random((nchords,2)) * TAU
    chords = np.array((r * np.cos(angles), r * np.sin(angles)))
    chords = np.swapaxes(chords, 0, 1)
    # The midpoints of the chords
    midpoints = np.mean(chords, axis=2).T
    return chords, midpoints

def get_chords_from_midpoints(midpoints):
    """Return the chords with the provided midpoints.

    Methods 2 and 3 share this code for retrieving the chord end points from
    the midpoints.

    """

    # We should probably watch out for the edge-case of a "vertical" chord
    # (y0=0), but it's rather unlikely over 10000 trials, so don't bother.
    chords = np.zeros((nchords, 2, 2))
    for i, (x0, y0) in enumerate(midpoints.T):
        m = -x0/y0
        c = y0 + x0**2/y0
        A, B, C = m**2 + 1, 2*m*c, c**2 - r**2
        d = np.sqrt(B**2 - 4*A*C)
        x = np.array( ((-B + d), (-B - d))) / 2 / A
        y = m*x + c
        chords[i] = (x, y)
    return chords

def bertrand2():
    """Generate random chords and midpoints using "Method 2".

    First select a random radius of the circle, and then choose a point
    at random (uniformly-distributed) on this radius to be the midpoint of
    the chosed chord.

    """

    angles = np.random.random(nchords) * TAU
    radii = np.random.random(nchords) * r
    midpoints = np.array((radii * np.cos(angles), radii * np.sin(angles)))
    chords = get_chords_from_midpoints(midpoints)
    return chords, midpoints

def bertrand3():
    """Generate random chords and midpoints using "Method 3".

    Select a point at random (uniformly distributed) within the circle, and
    consider this point to be the midpoint of the chosed chord.

    """

    # To ensure the points are uniformly distributed within the circle we
    # need to weight the radial distance by the square root of the random
    # number chosen on (0,1]: there should be a greater probability for points
    # further out from the centre, where there is more room for them.
    angles = np.random.random(nchords) * TAU
    radii = np.sqrt(np.random.random(nchords)) * r
    midpoints = np.array((radii * np.cos(angles), radii * np.sin(angles)))
    chords = get_chords_from_midpoints(midpoints)
    return chords, midpoints

bertrand_methods = {1: bertrand1, 2: bertrand2, 3: bertrand3}

def plot_bertrand(method_number):
    # Plot the chords and their midpoints on separate Axes for the selected
    # method of picking a chord randomly.

    chords, midpoints = bertrand_methods[method_number]()

    # Here's where we will keep track of which chords are longer than tlen
    success = [False] * nchords

    fig, axes = setup_axes()
    for i, chord in enumerate(chords):
        x, y = chord
        if np.hypot(x[0]-x[1], y[0]-y[1]) > tlen:
            success[i] = True
        if i < NCHORDS_TO_PLOT:
            line = Line2D(*chord, color=GREY, alpha=0.1)
            axes[0].add_line(line)
    axes[1].scatter(*midpoints, s=0.2, color=GREY)
    fig.suptitle('Method {}'.format(method_number))

    prob = np.sum(success)/nchords
    print('Bertrand, method {} probability: {}'.format(method_number, prob))
    plt.savefig('bertrand{}.png'.format(method_number))
    plt.show()

plot_bertrand(1)
plot_bertrand(2)
plot_bertrand(3)
References
- J. Bertrand, Calcul des probabilit?es, Gauthier-Villars, Paris, pp. 4–5 (1889).
- E. T. Jaynes, "The well-posed problem", Foundations of Physics, 3, 477–493 (1973).
- A. Drory, "Failure and Uses of Jaynes' Principle of Transformation Groups", Foundations of Physics, 45, 439–460 (2015). arXiv