How old are the world's nuclear reactors?
Posted on 19 April 2018
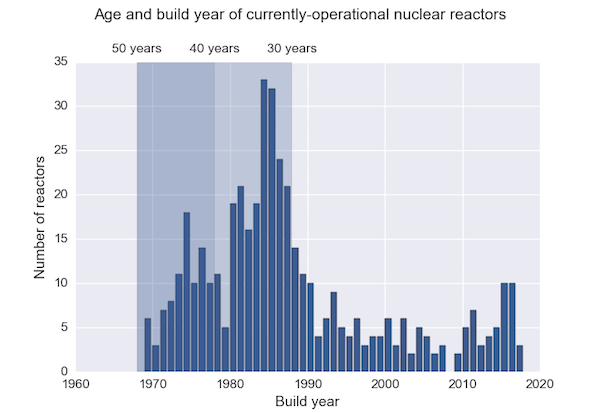
Most of the world's currently-operational nuclear reactors were built in the 1970s and 80s and with an expected lifespan of 30–40 years are coming to the end of their predicted lifetime. Many will need to be decommissioned in the not-too-distant future.
Using freely-available data from the IAEA's Power Reactor Information System (PRIS), the code below creates a barchart of the build year (actually, date connected to the grid) of all 448 currently operational nuclear reactors in the world. The average age is seen to be over 30 years from the output:
Mean reactor age: 30.3
Median reactor age: 33.0
Mode reactor age: 34.0
The drop-off in reactor builds after the 1987 Chernobyl disaster is also evident.
The code below requires the Pandas, Matplotlib and Seaborn libraries, and reads data from the file reactors.csv.
import pandas as pd, numpy as np
import matplotlib.pyplot as plt
from matplotlib.patches import Rectangle
import seaborn as sbs

sbs.set(font_scale=1.25)

csv_name = 'reactors.csv'

# Read in the data, discard non-operational reactors, get build year and age.
df = pd.read_csv(csv_name, usecols=[1,5], names=['status', 'dateconnected'],
                 header=None)
df = df[df['status']=='Operational']
df['dateconnected'] = pd.to_datetime(df['dateconnected'])
this_year = pd.datetime.now().year
df['year'] = df['dateconnected'].dt.year
df['age'] = this_year - df['dateconnected'].dt.year

# Count reactors of each age (in years) and sort; find averages.
reactors_by_age = df['age'].value_counts().sort_index()
mean_age = df['age'].mean()
median_age = df['age'].median()
mode_age = df['age'].mode()

print('Mean reactor age: {:.1f}'.format(mean_age))
print('Median reactor age: {:.1f}'.format(median_age))
# NB mode() returned a Pandas Series.
print('Mode reactor age: {:.1f}'.format(mode_age[0]))

# Now convert to build year and plot a bar chart
reactors_by_buildyear = df['year'].value_counts().sort_index()

fig, ax = plt.subplots()
ax.bar(reactors_by_buildyear.index, reactors_by_buildyear,
       fc=sbs.xkcd_rgb["denim blue"])

# Set the y-axis max limit to the largest number greater than the maximum
# number of reactors built in a single year that is divisible by 5.
max_built_per_year = reactors_by_buildyear.max()
ylim = 5 * (max_built_per_year // 5 + 1)
ax.set_ylim(0,ylim)

# Draw some semi-transparent rectangles over significant age ranges.
ages = np.array((30, 40, 50))
opacities = (0.15, 0.25)
for i, age in enumerate(ages[1:]):
    rectangle = Rectangle((this_year-age, 0), age-ages[i-1], ylim,
                    alpha=opacities[i], fc=sbs.xkcd_rgb["denim blue"])
    ax.add_patch(rectangle)

# Labels, twinned axis with reactor ages on ticks.
ax.set_xlabel('Build year')
ax.set_ylabel('Number of reactors')

ax_top = ax.twiny()
ax_top.set_xlim(ax.get_xlim())
ax_top.grid(False)
ax_top.set_xticks((this_year - ages)[::-1])
ax_top.set_xticklabels(['{:2d} years'.format(age) for age in ages[::-1]])
fig.suptitle('Age and build year of currently-operational nuclear reactors')
fig.subplots_adjust(top=0.85)

plt.savefig('reactor_ages.png')
plt.show()