P7.4.5The Planck function
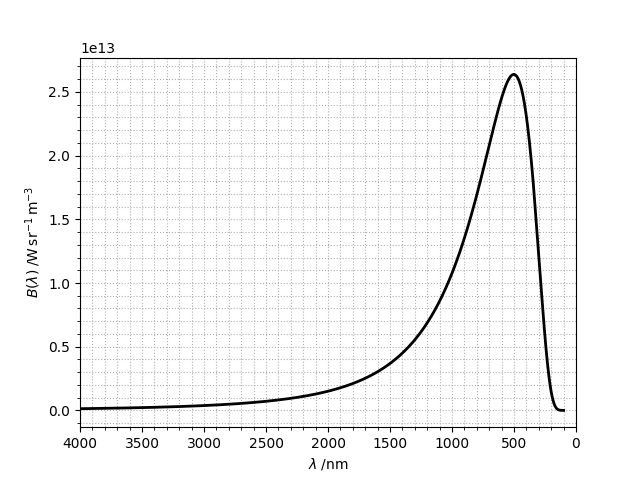
Write a program to plot the Planck function, \(B(\lambda)\), for the spectral radiance of a Black body at temperature \(T\) as a function of wavelength, \(\lambda\) for the Sun (\(T = 5778\;\mathrm{K}\)):
\[B(\lambda) = \frac{ 2hc^2 }{ \lambda^5 } \frac{ 1 }{ \exp\left( hc / \lambda k_\mathrm{B}T \right) - 1}\]
Use a NumPy array to store values of \(B(\lambda)\) from 100 to 5000 nm, but set the wavelength range to decrease from 4000 nm to 0.
Show solution
Here is one solution in monochrome with gridlines and a reversed \(x\)-axis.
planckfunction
import numpy as np
import matplotlib.pyplot as plt

# Physical constants in SI units: Planck's constant (J.s),
# the speed of light (m.s-1), Boltzmann's constant (J.K-1)
h, c, kB = 6.62606957e-34, 299792458, 1.3806488e-23
# Sun temperature, K
T = 5778

lambda_min = 100  # nm
lambda_max = 5000  # nm
n = 5000
wv = np.linspace(lambda_min, lambda_max, n)

# Planck curve as a function of wavelength in nm
B = (
    2
    * h
    * c**2
    / (wv * 1.0e-9) ** 5
    / (np.exp(h * c / wv / 1.0e-9 / kB / T) - 1)
)

fig, ax = plt.subplots()
ax.plot(wv, B, "k", lw=2)
ax.set_xlabel(r"$\lambda\;/\mathrm{nm}$")
ax.set_ylabel(r"$B(\lambda)\;/\mathrm{W\,sr^{−1}\,m^{−3}}$")

# Wavelength decreases from left to right: 4000 nm to 0:
ax.set_xlim(left=4000, right=0)
ax.minorticks_on()
ax.grid(which="both", ls=":")

plt.show()