P7.5.4The Julia set
The Julia set associated with the complex function \(f(z) = z^2 + c\) may be depicted using the following algorithm.\(\renewcommand\Re{\operatorname{Re}}\renewcommand\Im{\operatorname{Im}}\)
For each point, \(z_0\), in the complex plane such that \(-1.5 \le \Re[z_0] \le 1.5\) and \(-1.5 \le \Im[z_0] \le 1.5\), iterate according to \(z_{n+1} = z_n^2 + c\) where \(c\) is a some (complex) constant. Colour the pixel in an image corresponding to this region of the complex plane according to the number of iterations required for \(|z|\) to exceed some critical value, \(|z|_\mathrm{max}\) (or black if this does not happen before a certain maxmimum number of iterations \(n_\mathrm{max}\)).
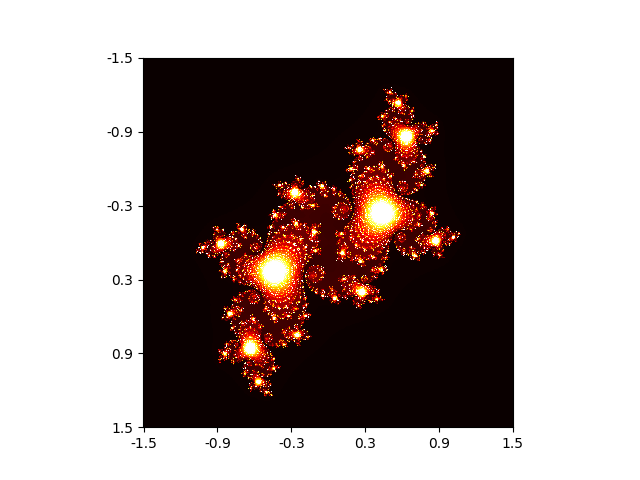
Write a program to plot the Julia set for \(c = -0.1 + 0.65j\), using \(|z|_\mathrm{max}=10\) and \(n_\mathrm{max}=500\).
Show solution
The code below is one way of plotting the required Julia set. There are many different ways of picking the pixel colours.
import numpy as np
import matplotlib.pyplot as plt
import matplotlib.cm as cm

# Image width and height; parameters for the plot
im_width, im_height = 500, 500
c = complex(-0.1, 0.65)
zabs_max = 10
nit_max = 1000
xmin, xmax = -1.5, 1.5
xwidth = xmax - xmin
ymin, ymax = -1.5, 1.5
yheight = ymax - ymin

julia = np.zeros((im_width, im_height))
for ix in range(im_width):
    for iy in range(im_height):
        nit = 0
        # Map pixel position to a point in the complex plane
        z = complex(
            ix / im_width * xwidth + xmin, iy / im_height * yheight + ymin
        )
        # Do the iterations
        while abs(z) <= zabs_max and nit < nit_max:
            z = z**2 + c
            nit += 1
        shade = 1 - np.sqrt(nit / nit_max)
        ratio = nit / nit_max
        julia[ix, iy] = ratio

fig, ax = plt.subplots()
ax.imshow(julia, interpolation="nearest", cmap=cm.hot)
# Set the tick labels to the coordinates of z0 in the complex plane
xtick_labels = np.linspace(xmin, xmax, int(xwidth / 0.5))
ax.set_xticks([(x - xmin) / xwidth * im_width for x in xtick_labels])
ax.set_xticklabels([f"{xtick:.1f}" for xtick in xtick_labels])
ytick_labels = np.linspace(ymin, ymax, int(yheight / 0.5))
ax.set_yticks([(y - ymin) / yheight * im_height for y in ytick_labels])
ax.set_yticklabels([f"{ytick:.1f}" for ytick in ytick_labels])
plt.show()