P7.5.5The effect of sea-level rise on Great Britain
The mean altitudes of the 10 km \(\times\) 10 km hectad squares used by the United Kingdom's Ordnance Survey in mapping Great Britain are given in the NumPy array file gb-alt.npy.
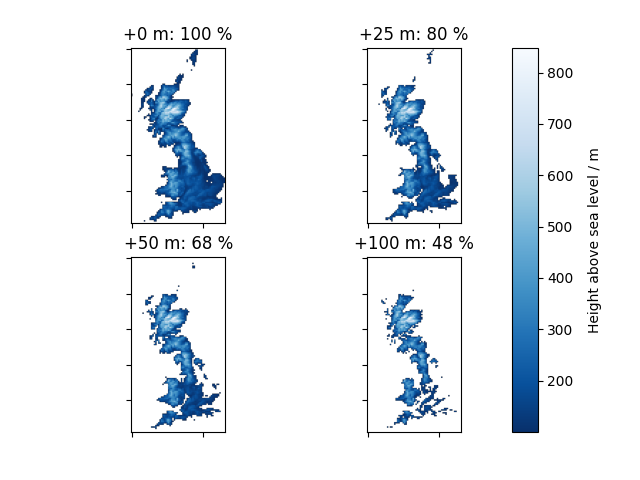
Plot a map of the island using this data with ax.imshow and plot further maps assuming a mean sea-level rise of (a) 25 m, (b) 50 m, (c) 100 m. In each case, deduce the percentage of land area remaining, relative to its present value.
Show solution
The code below creates a plot of Great Britain under various amounts of water.
uksealevelrise
import numpy as np
import matplotlib.pyplot as plt
from matplotlib import cm

Z = np.load("gb-alt.npy")
# Approximate area in km^2
area0 = np.sum(Z > 0) * 100

fig, axes = plt.subplots(nrows=2, ncols=2)

# Set the mean sea level at these heights in m relative to its present value
sealevels = (0, 25, 50, 100)

for i, sealevel in enumerate(sealevels):
    ax = axes[i // 2, i % 2]
    area = np.sum(Z > sealevel) * 100
    Zp = Z.copy()
    Zp[Zp <= sealevel] = np.nan
    im = ax.imshow(Zp, cmap=cm.Blues_r)
    ax.set_xticklabels([])
    ax.set_yticklabels([])
    percent_area = int(area / area0 * 100)
    ax.set_title(rf"+{sealevel:d} m: {percent_area:d} %")

fig.subplots_adjust(bottom=0.1, right=0.8, top=0.9)
cbar_ax = fig.add_axes([0.8, 0.1, 0.04, 0.8])
cbar = fig.colorbar(im, cax=cbar_ax, label="Height above sea level / m")
cbar.set_label("Height above sea level / m", labelpad=10)
plt.show()