Question P9.3.2
The populations of each state in the USA over the years 1993--2018 are given in the file US-populations.txt. Read these data into a pandas DataFrame with a suitable index, and analyze them for any interesting trends. Then combine these data with those of Problem P9.3.1 to determine the states with the greatest and least prevalence of tuberculosis per head of population in 2018.
Solution P9.3.2
Here are some ideas for analysis of the population data.
import pandas as pd
import matplotlib.pyplot as plt

pops = pd.read_csv('US-populations.txt', index_col=0)
pops.columns = pops.columns.astype(int)

print('The most populous states (2018)')
print(pops[2018].sort_values(ascending=False)[:10])

print('The least populous states (2018)')
print(pops[2018].sort_values(ascending=False)[-10:])

print('States with an annual population decrease of greater than 10000')
exodus_states = pops.index[(pops.T.diff()<-10000).any()]
print(exodus_states.tolist())
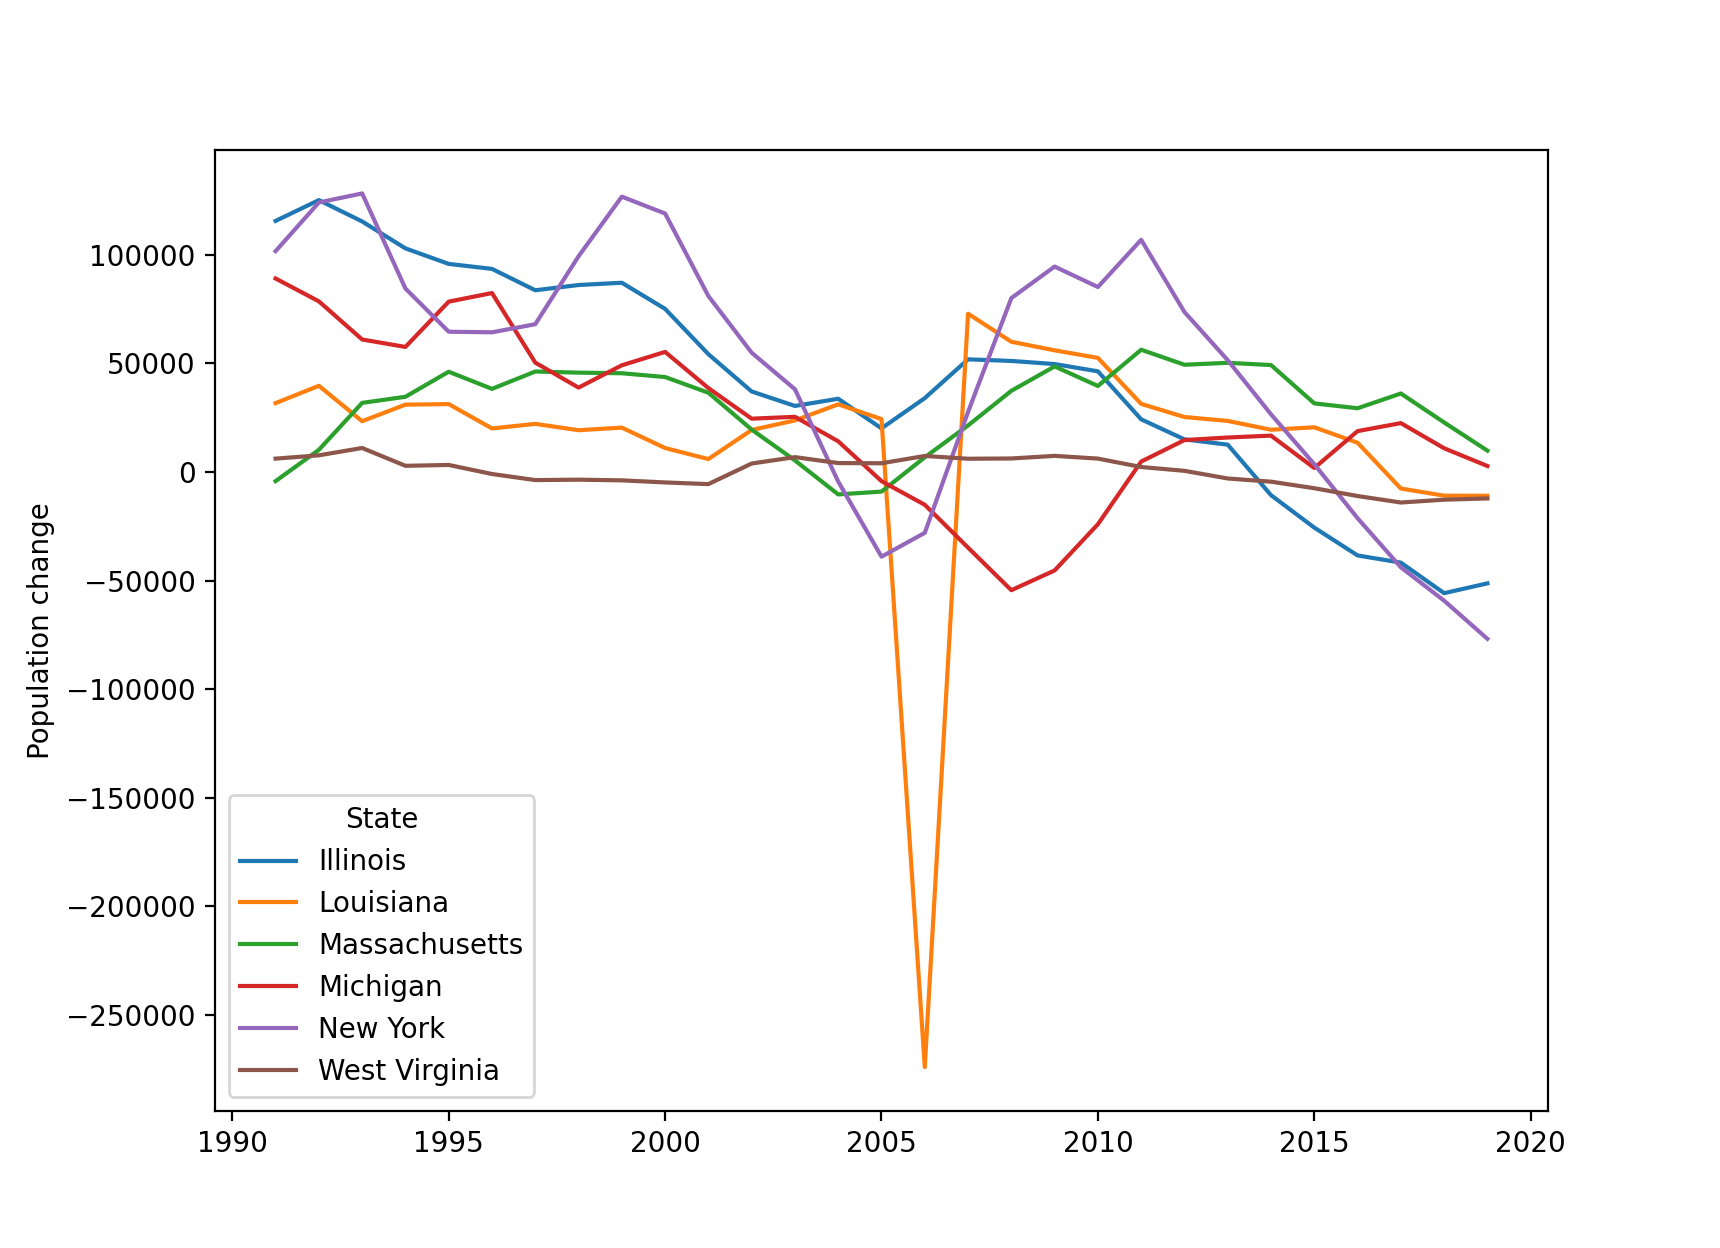
pops.loc[exodus_states].T.diff().plot()
plt.ylabel('Population change')
plt.show()

# Read in the TB data
df = pd.read_csv('tb-cases.txt', sep='\t', usecols=('State', 'Year', 'Cases'),
                 skipfooter=21)
# Extract only year 2018 and drop the columns we don't need.
df = df[df['Year']==2018]
df = df.set_index(df['State']).drop(['State', 'Year'], axis=1)
df['pops'] = pops[2018]
df['TB prevalence per million'] = df['Cases'] / df['pops'] * 1.e6
print('Lowest and highest TB prevalence in 2018')
print(df['TB prevalence per million'].sort_values()[[0,-1]])
Output:
The most populous states (2018)
State
California        39461588
Texas             28628666
Florida           21244317
New York          19530351
Pennsylvania      12800922
Illinois          12723071
Ohio              11676341
Georgia           10511131
North Carolina    10381615
Michigan           9984072
Name: 2018, dtype: float64

The least populous states (2018)
State
Maine                   1339057
Montana                 1060665
Rhode Island            1058287
Delaware                 965479
South Dakota             878698
North Dakota             758080
Alaska                   735139
District of Columbia     701547
Vermont                  624358
Wyoming                  577601
Name: 2018, dtype: float64

States with an annual population decrease of greater than 10000
['Illinois', 'Louisiana', 'Massachusetts', 'Michigan', 'New York', 'West Virginia']

Lowest and highest TB prevalence in 2018

State
Wyoming     1.731299
Alaska     85.698079
Name: TB prevalence per million, dtype: float64
The plot of states that have seen a population decrease shows the effect of Hurricane Katrina in 2005, and a variety of more complex changes in states such as Michigan and New York.
