Question P9.3.1
Use pandas to read in the file, tb-cases.txt, which provides numbers of cases of tuberculosis in the USA, broken down by state for the years 1993–2018. Create a DataFrame with a hierarchical index (MultiIndex) consisting of the state name and year.
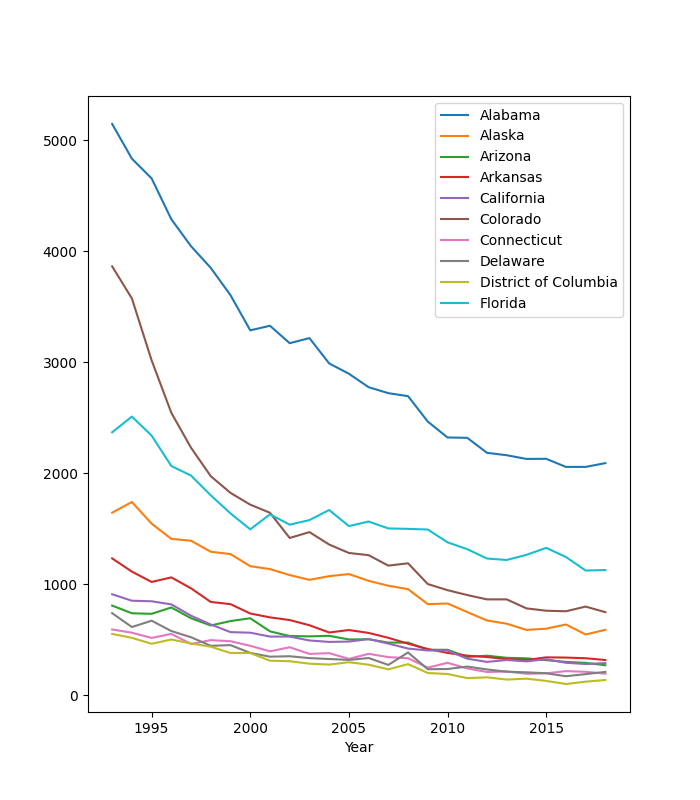
Plot these data appropriately and determine the state with the greatest relative decrease in tuberculosis over the time period considered.
Solution P9.3.1
Here is one approach, choosing to plot only data for states with at least 500 TB cases.
import pandas as pd
import matplotlib.pyplot as plt

# Read in the tab-delimited file, skipping the footer lines.
df = pd.read_csv('tb-cases.txt', sep='\t', usecols=('State', 'Year', 'Cases'),
                 skipfooter=21)

# Drop rows of totals for each state across all years.
df = df[df['Year'].notna()]
# Cast the Year column to integer type.
df['Year'] = df['Year'].astype(int)
# Create a MultiIndex from the State and Year columns.
df.index = pd.MultiIndex.from_frame(df[['State', 'Year']])
df = df.drop('State', axis=1)
df = df.drop('Year', axis=1)

cases_1993 = df.xs(1993, level=1)
cases_2018 = df.xs(2018, level=1)
r = (cases_2018 - cases_1993) / cases_1993 * 100
r.loc[r.idxmin()]

# Plot TB time series for each state with a maximum number of cases greater
# than 500.
fig, ax = plt.subplots()
df2 = df.unstack(level=0)
idx = df2.max() >= 500
df2.T[idx].T.plot(ax=ax)
# Tidy the legend by selecting the state names only for it.
ax.legend(df2.columns.get_level_values('State'))
plt.show()
The numbers are relatively small but the winner is West Virginia:
               % change 1993 - 2018
State
West Virginia                 -92.0