
The UK Civil Aviation Authority (CAA) compares the planned and actual times of the flights at 25 UK airports and publishes monthly punctuality statistics for each airport, airline and route. The earlier post Analysing flight punctuality data for UK airports looked at a single year of these statistics; this one covers every month since January 2018, 14.2 million planned flights in all, and its figures, text and tables are regenerated each month from the CAA's files, which appear about six weeks after the month's end.
Last updated 21 November 2026, with data to September 2026.
Data
The CAA counts a flight as on time if it leaves its stand (on departure) or reaches it (on arrival) no more than 15 minutes after its planned time; the planned times are those agreed with the airport's schedule coordinator, including changes made up to 30 minutes before the flight. A flight is cancelled if it is cancelled less than 24 hours before (or after) its planned time; a flight cancelled further ahead does not count as cancelled. Each month's file has a row for every combination of reporting airport, origin or destination, airline, direction (arrival or departure) and type of service (scheduled or charter), with the number of flights, the percentages of them in nine bands of delay, from more than 15 minutes early to more than six hours late, and their average delay. The CAA has measured delays in this way since January 2018, when it began to use the times at which aircraft left and reached their stands rather than estimating them from runway times, and to count cancellations; the analysis here therefore starts in that month. Its notes give the details. The statistics are monthly totals, so they cannot show how punctuality varies with the time of day or the day of the week.
Three features of the files matter when their rows are combined. First, the percentages are of the planned flights, which include the cancelled flights and a handful of unmatched flights (those that operated but whose planned time is unknown), so that a cancelled flight counts as not on time. The percentages must be turned back into numbers of flights before rows are added together:
planned = matched + cancelled + unmatched
on_time = (early_15_pct + early_pct + late_0_15_pct) / 100 * planned
delay_minutes = average_delay * matched
Second, the average delay is a mean over the flights that operated (the matched flights) in which early flights count as zero delay, and in the files that separate arrivals from departures it is rounded to a whole minute; the rounding errors largely cancel, so that an airport's mean delay over a month is typically uncertain by only a few hundredths of a minute. Third, a flight between two of the reporting airports appears in both airports' rows. The files also leave out the few operators that have not consented to publication. Computed in this way, the percentages of flights on time and cancelled for each airport and month reproduce those in the CAA's own summary tables, published since October 2024, to within a fraction of a percentage point.
Airline names
The CAA names each airline by the company that operates the flight, often by its legal name, which is not always the name under which the flight is sold. British Airways' flights, for example, are operated by three companies, which the files list separately; in the twelve months to September 2026 these were British Airways (283,800 flights, 78% on time), BA CityFlyer (39,007 flights, 74% on time) and BA Euroflyer (28,238 flights, 69% on time). The files list easyJet, Ryanair and Wizz Air each under several names, because each formed subsidiaries in the UK or elsewhere in Europe in preparation for Brexit: Wizz Air UK first appears in November 2018, easyJet Europe in March 2019 and Ryanair UK in January 2021. Emerald Airlines operates the flights sold as Aer Lingus Regional. Names also change: Norwegian Air Shuttle's flights moved to the name NORWEGIAN AIR SHUTTLE AOC AS in August and September 2025, and the flights of KM Malta Airlines, which replaced Air Malta at the end of March 2024, were listed as AIR MALTA until September 2025 (and are missing from the files for August, October and November 2025). The CAA's summary tables combine some airlines with their subsidiaries, but not consistently: its tables for September 2026 list NORWEGIAN AIR GROUP and LUFTHANSA alongside NORWEGIAN AIR SHUTTLE AOC AS and LUFTHANSA CITY AIRLINES GMBH.
This post therefore assigns each of the CAA's names to an operator (the company), a brand (the name under which its flights are sold) and a group (the company's owner), in the table below; the figures use the brand. A name that the table does not list keeps the CAA's name at all three levels.
Trends
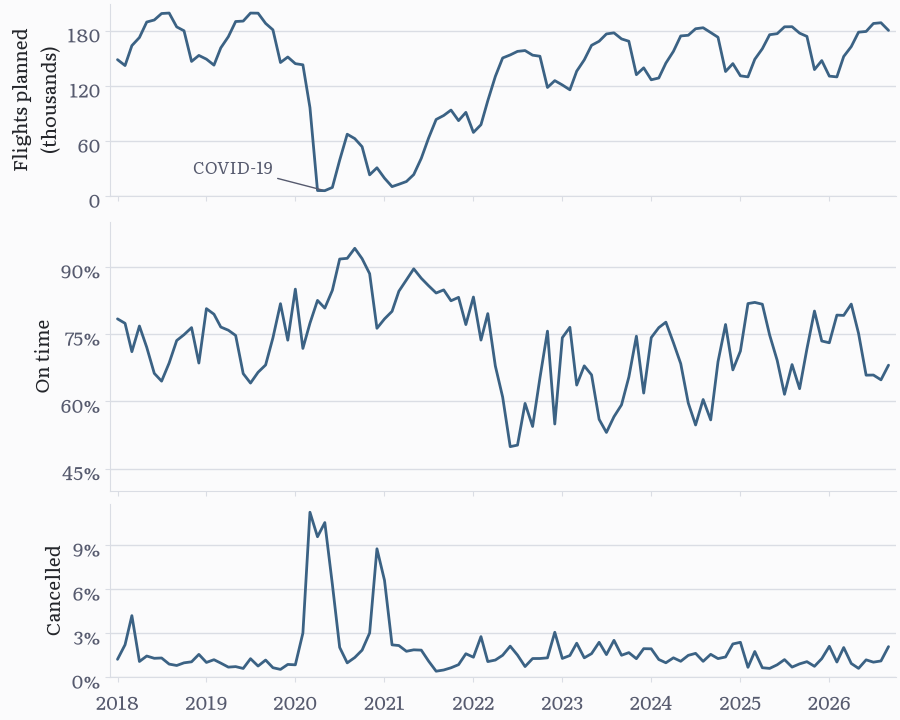
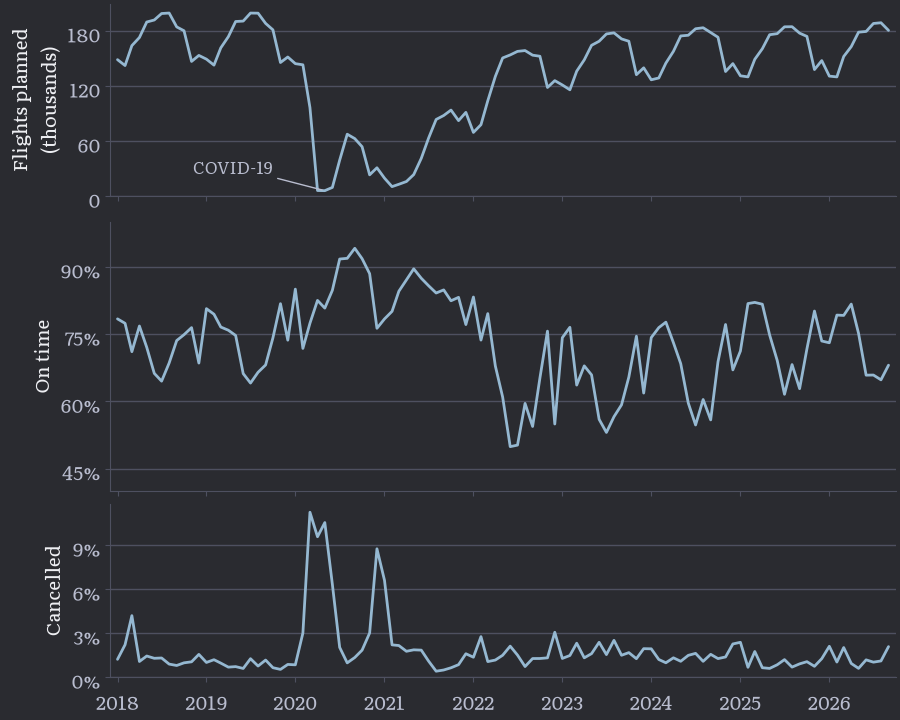
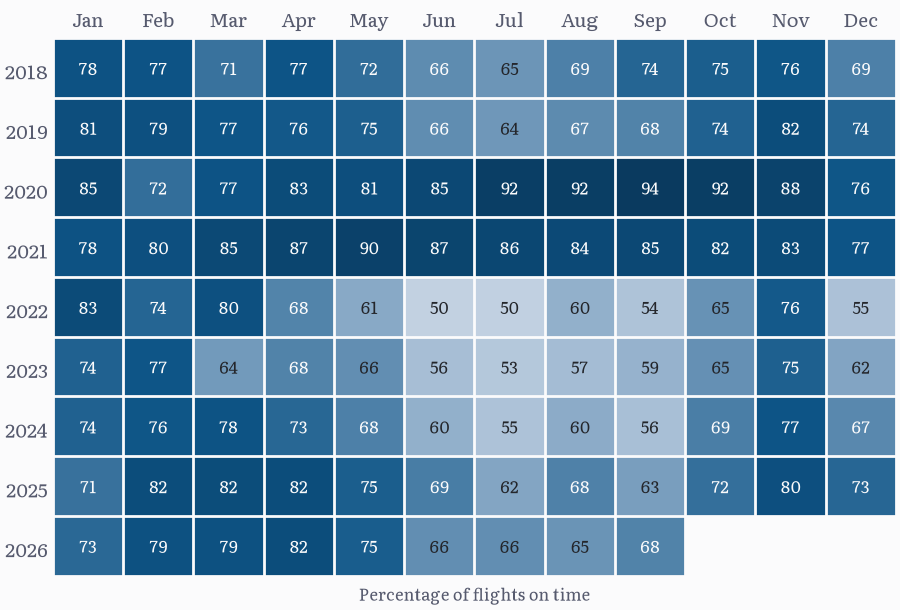
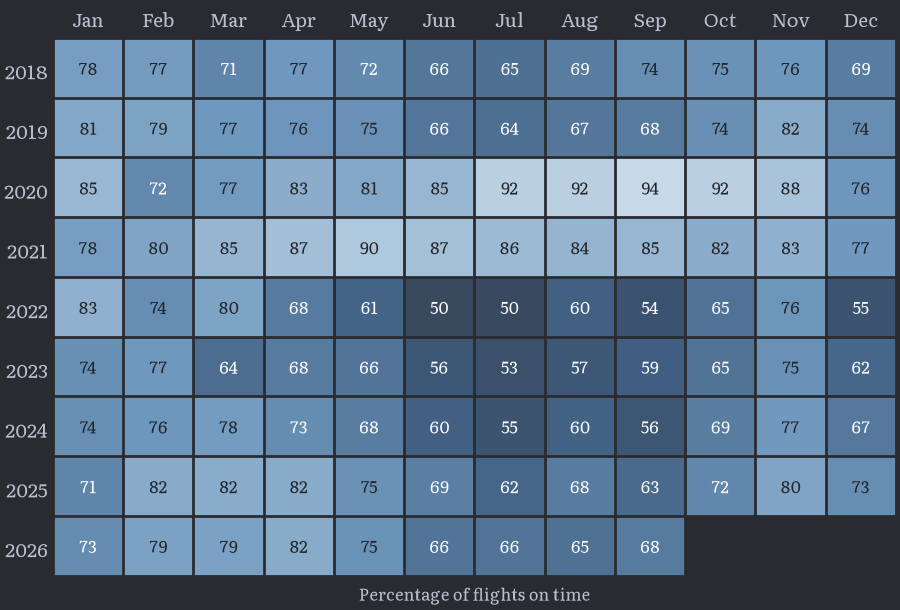
In the twelve months to September 2026, 72.7% of the 2.0 million planned flights were on time and 1.3% were cancelled, compared with 72.9% and 0.9% in 2019, the last year before the COVID-19 pandemic. The most punctual year was 2020, when there were few flights, and the least punctual month was June 2022, in which only 50% of flights were on time. Flights are least punctual in summer, when the airports are busiest: since 2022, 60% of flights in June, July and August have been on time, against 74% from November to February.
Airports
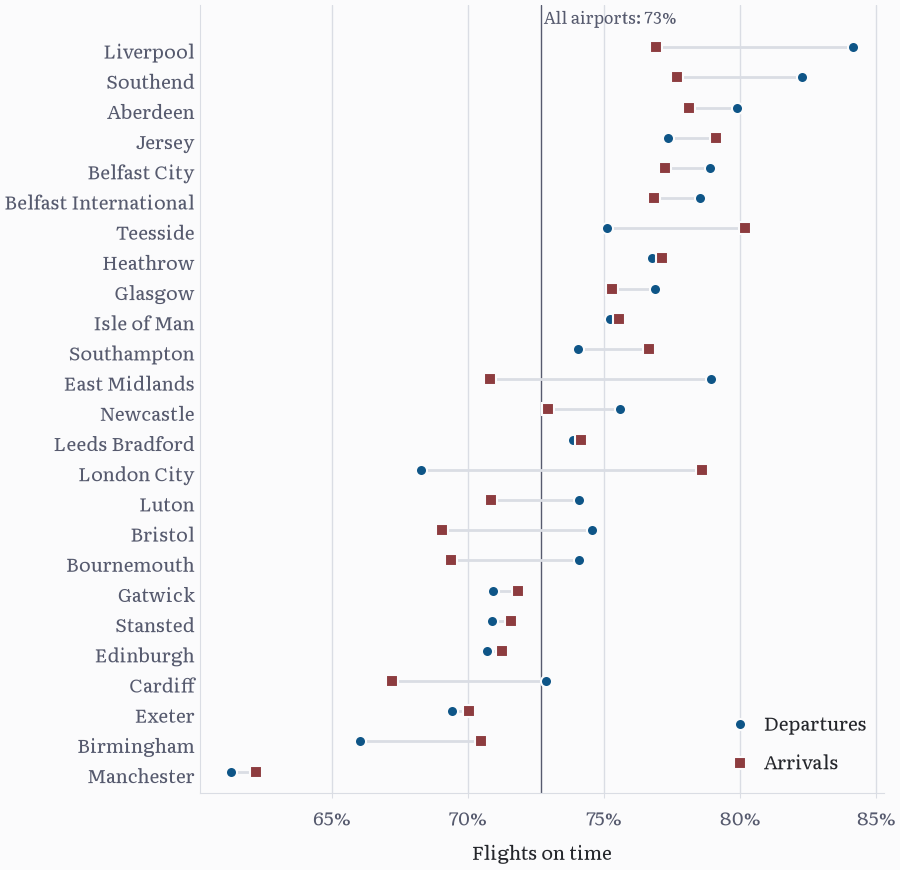
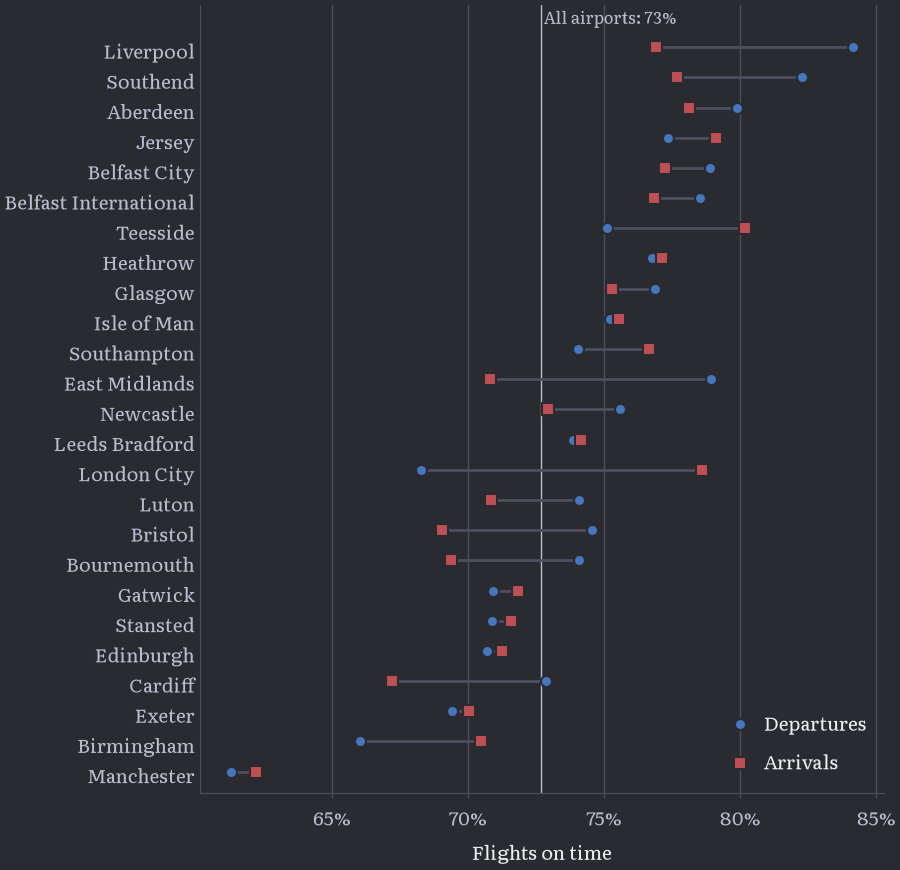
Of the airports with at least 20,000 flights in the twelve months to September 2026, Liverpool was the most punctual, with 81% of its flights on time, and Manchester the least, with 62% (and a mean delay of 21 minutes). At most airports departures and arrivals are about equally punctual; the largest difference among these airports is at London City, where 68% of departures and 79% of arrivals were on time.
Airlines
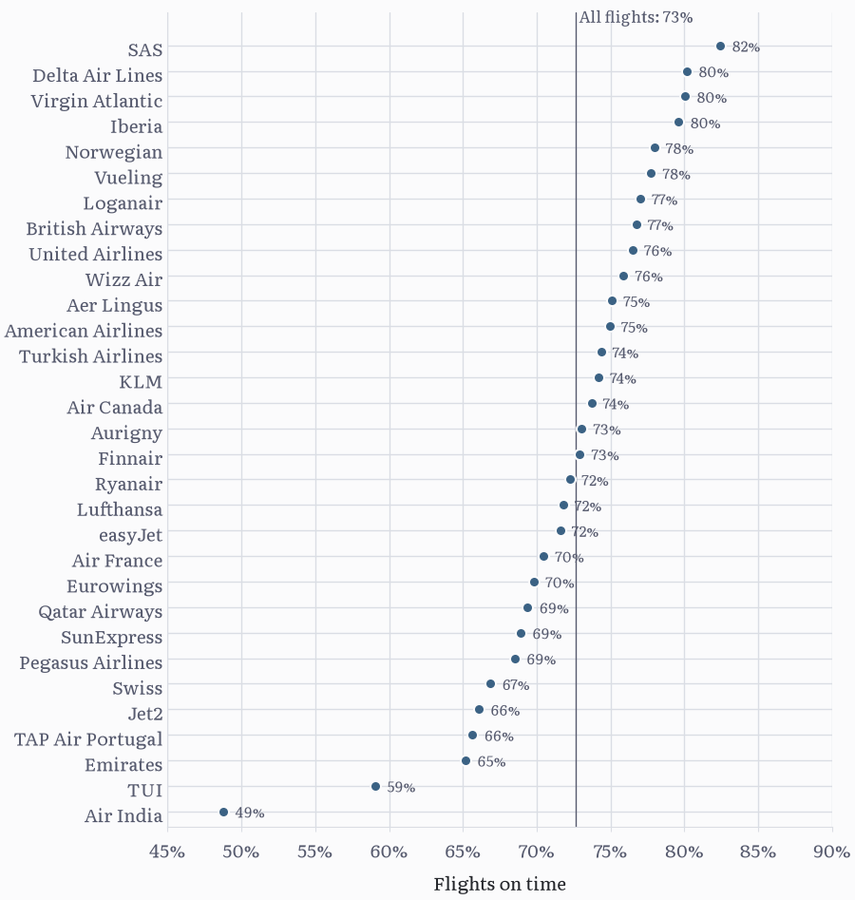
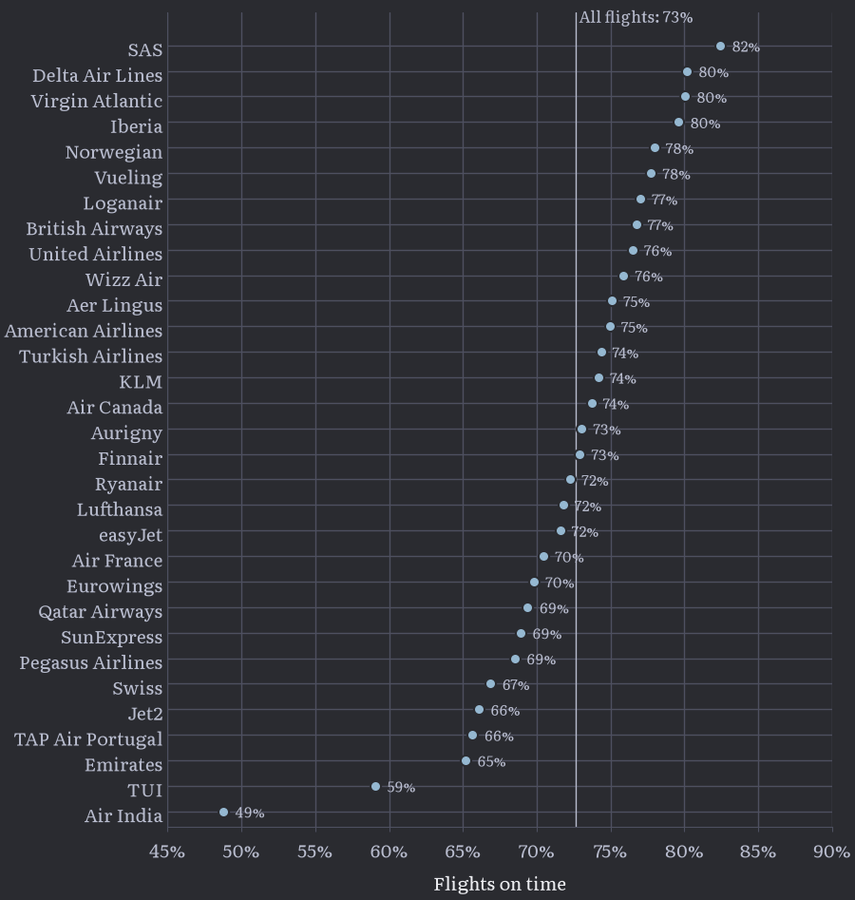
The three largest airlines at the reporting airports, easyJet (405,931 flights, 72% on time), Ryanair (357,783 flights, 72% on time) and British Airways (351,045 flights, 77% on time), together accounted for 57% of the flights planned in the twelve months to September 2026. Of the airlines with at least 5,000 flights, SAS was the most punctual (82% on time) and Air India the least (49%).
Airlines and airports
The punctuality of an airline's flights depends on where they fly from: in the twelve months to September 2026, easyJet's flights at Leeds Bradford were on time 55% of the time, and at Liverpool 81% of the time.
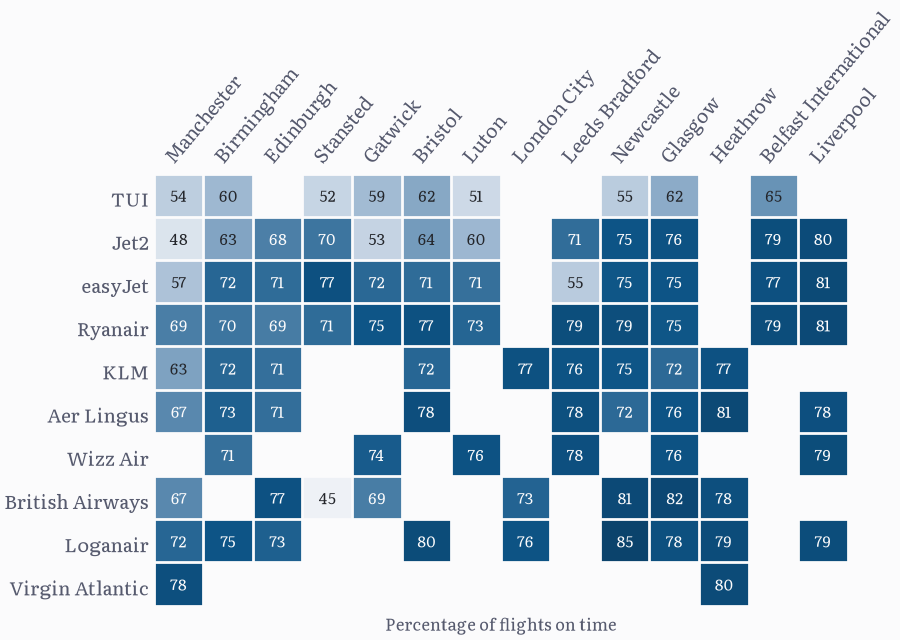
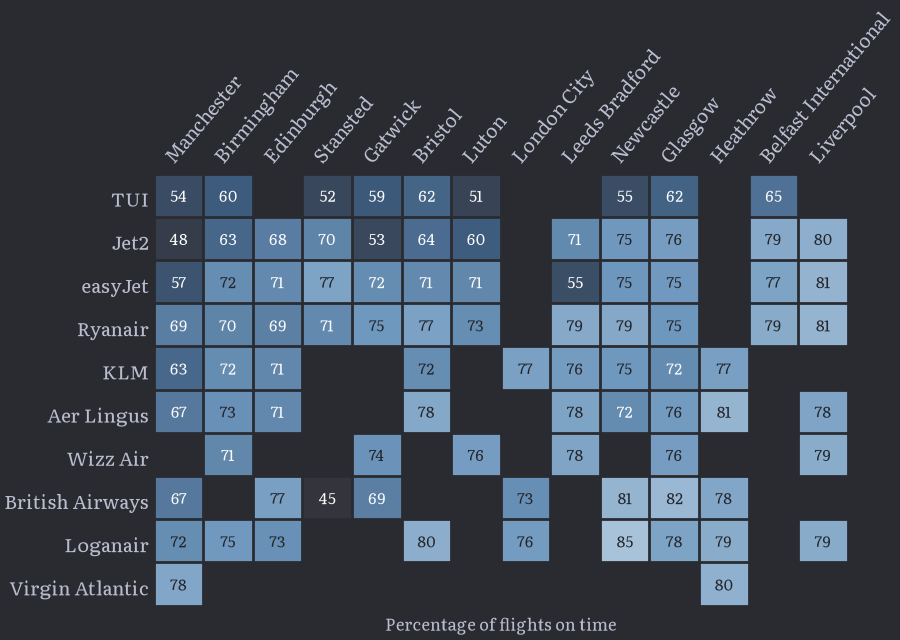
An airline that flies mostly from a congested airport therefore looks worse than one that flies from a quiet one, whatever its own performance. A fairer comparison is with the other airlines' flights at the same airports at the same times, a form of indirect standardisation (the method behind the standardized mortality ratio). For airline \(a\), divide its flights into cells \(c\), each an airport, direction and month; if it planned \(n_{ac}\) flights in cell \(c\), of which \(k_{ac}\) were on time, and a fraction \(p_c^{(-a)}\) of the other airlines' flights in the same cell were on time, the percentage of its flights expected to be on time is
and the difference
measures, in percentage points, how much more often than the other airlines its flights were on time. Leaving the airline's own flights out of \(p_c^{(-a)}\) matters for the largest airlines, which are most of the traffic at some airports; cells in which the other airlines had fewer than 20 flights are left out.
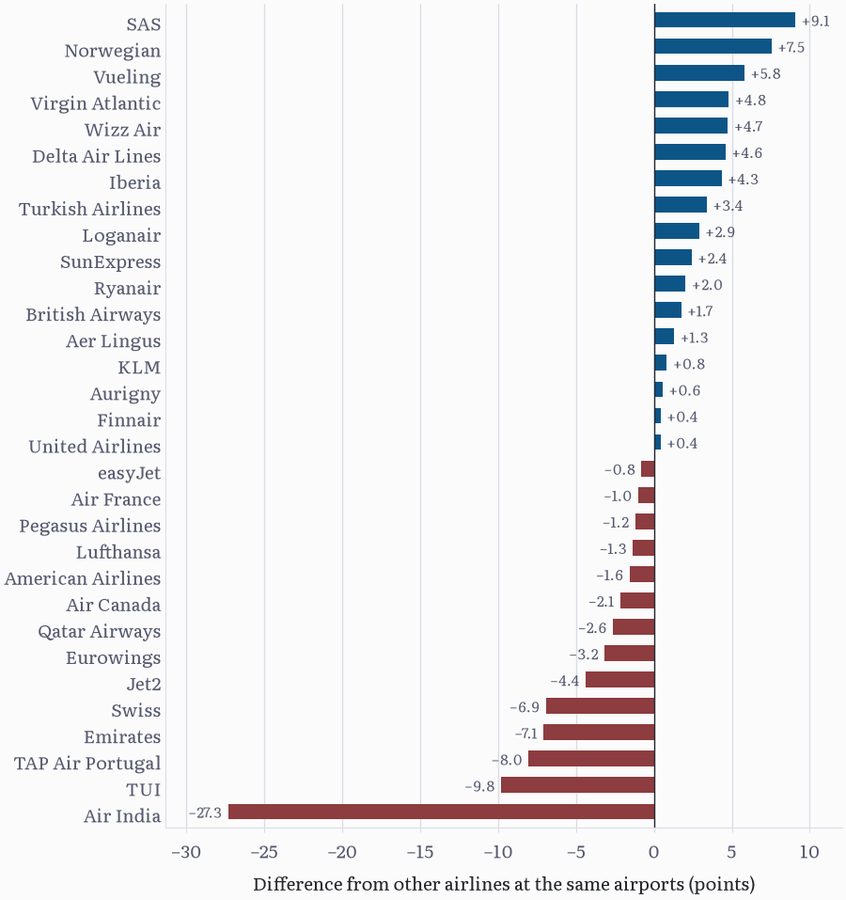
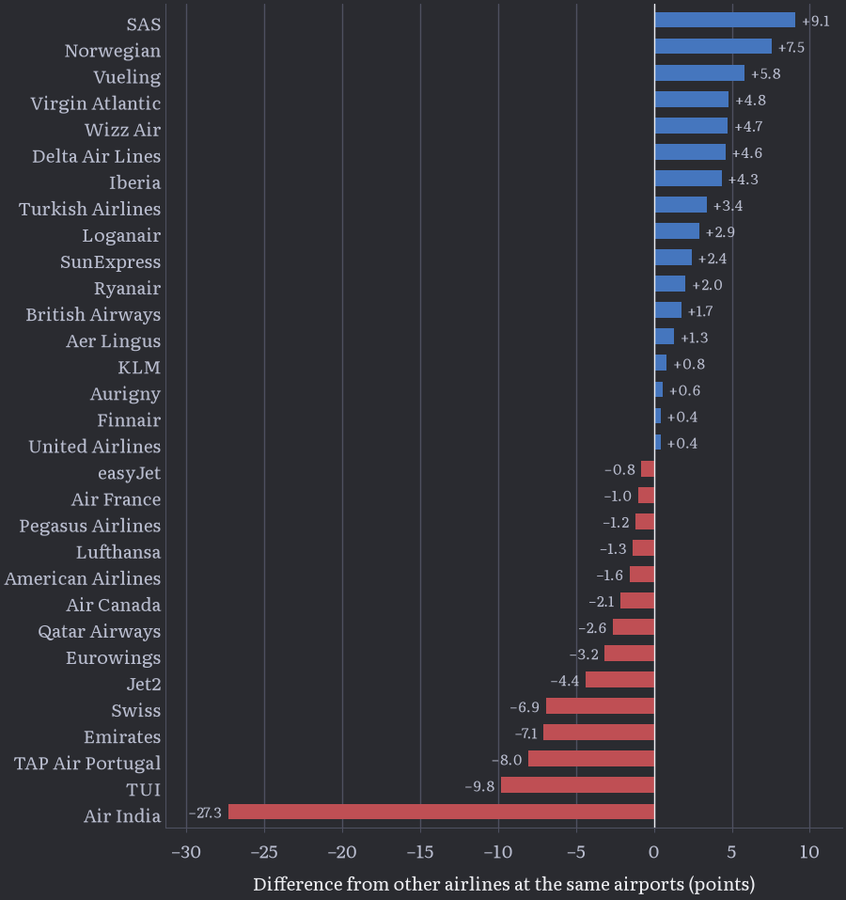
On this measure, SAS's flights were on time 9.1 percentage points more often than other airlines' flights at the same airports in the same months, and Norwegian's 7.5 points more often; Air India's were 27.3 points less often, and TUI's 9.8 points less often.
The same comparison works the other way round: for an airport, the cells are an airline, direction and month, and the airport's flights are compared with the same airlines' flights at the other airports at the same times.
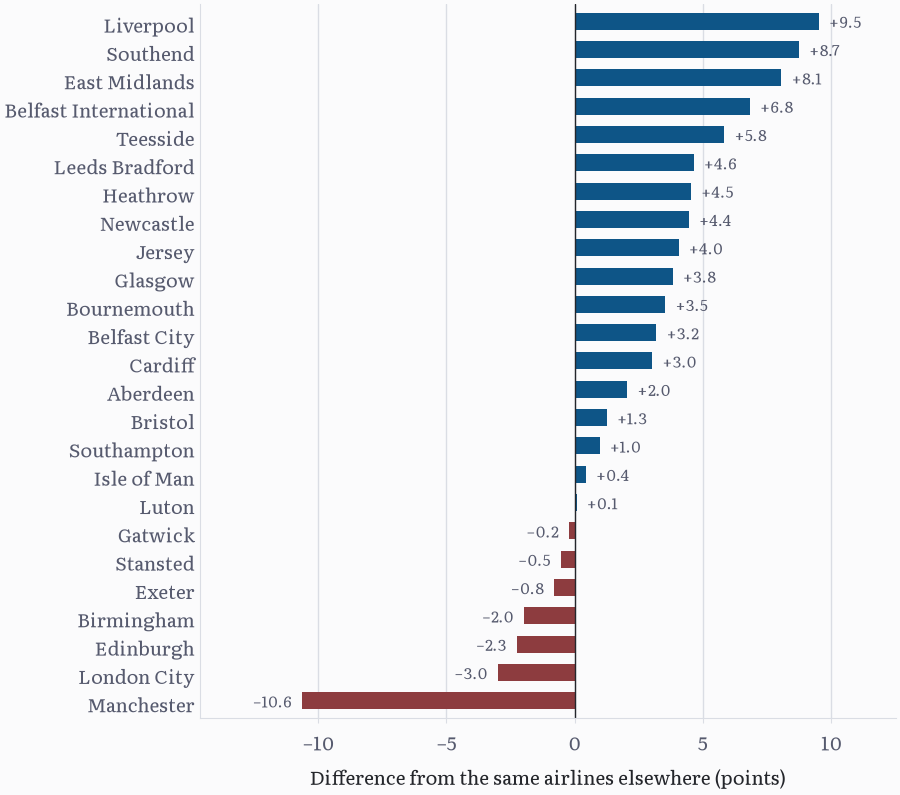
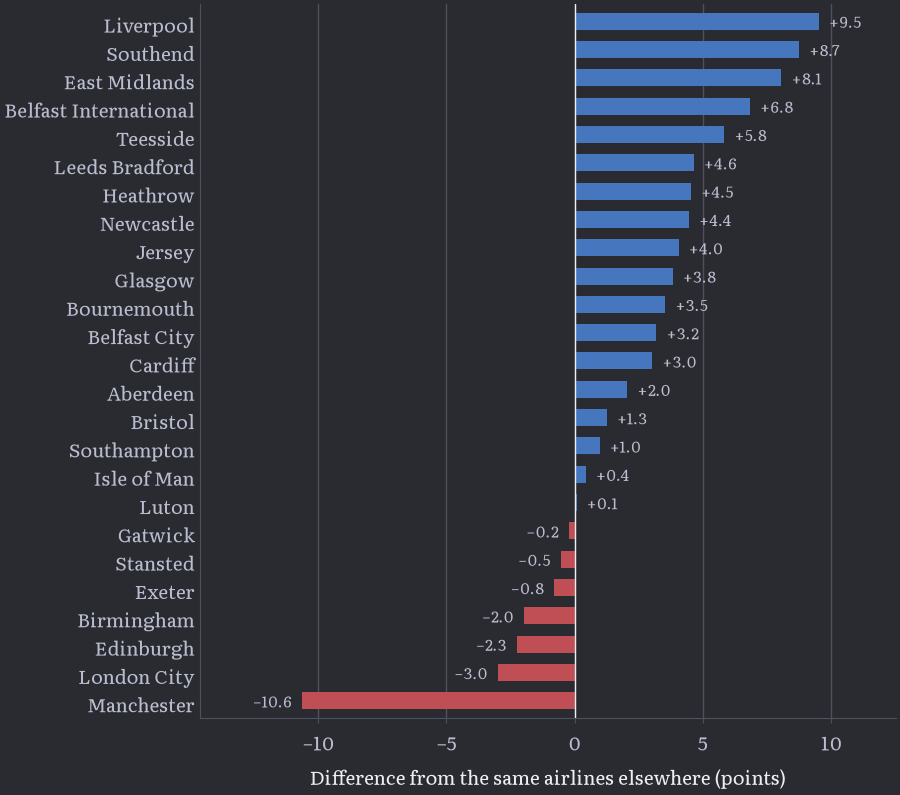
Flights at Manchester were on time 10.6 percentage points less often than the same airlines' flights elsewhere, and those at Liverpool 9.5 points more often.
Origins of arrivals
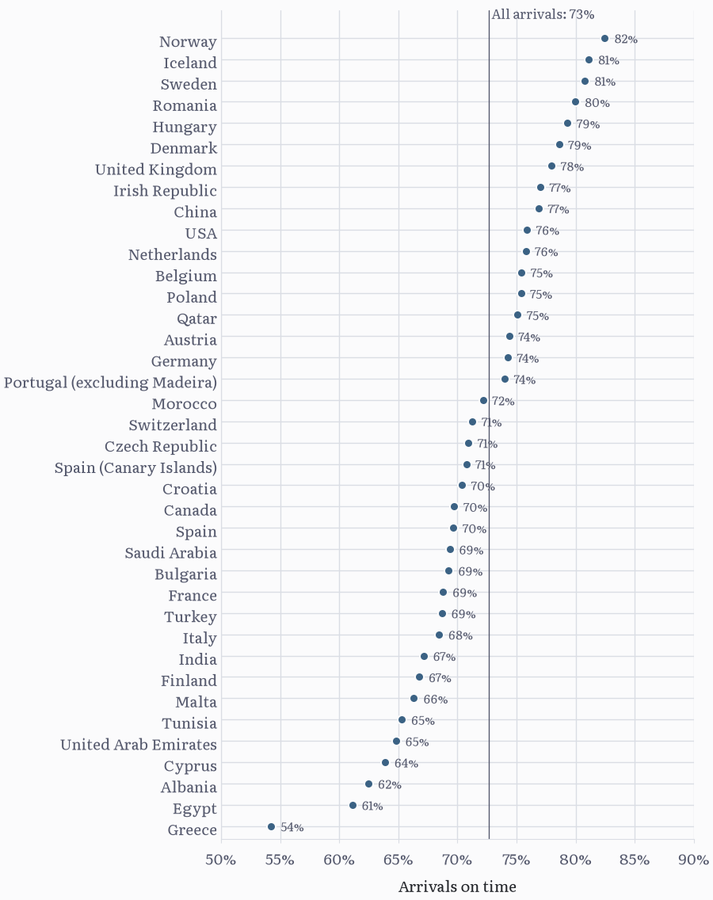
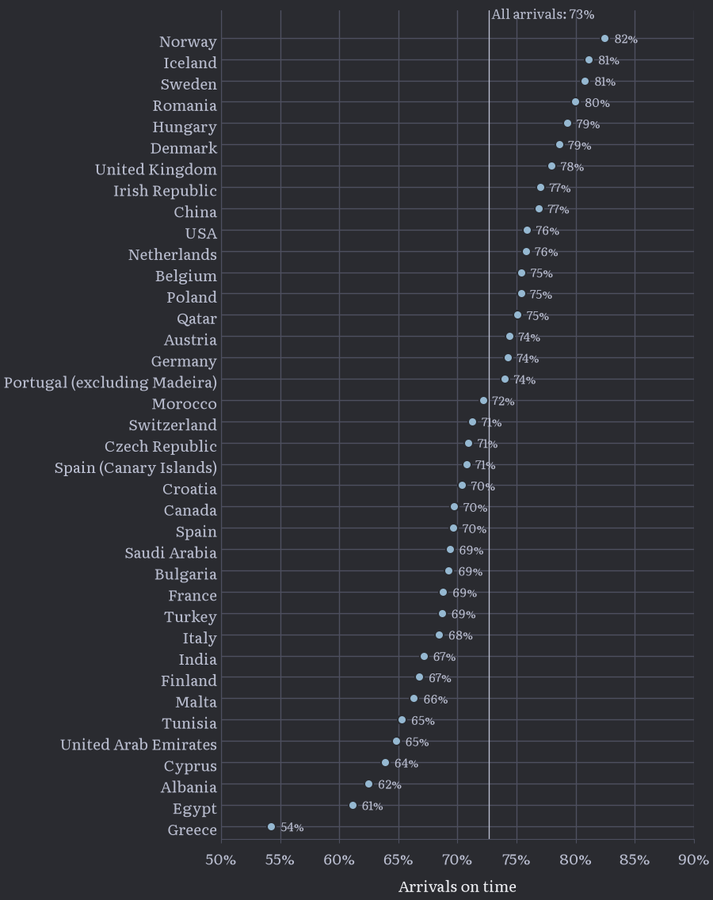
An arriving flight brings with it any delay at its origin. Of the countries from which at least 3,000 flights arrived in the twelve months to September 2026, flights from Norway were the most punctual (82% on time) and those from Greece the least (54%).
Domestic flights between two of the reporting airports appear at both ends, which shows how much of a delay is recovered in the air. Over the 136 combinations of route and airline with at least 300 flights each way in the twelve months to September 2026, the mean delay on departure was 12.7 minutes and on arrival 11.9 minutes: domestic flights recover very little of their delay in the air.
Explorer
The table gives the statistics for the twelve months to September 2026 for each airline, airport, origin or destination, or country, optionally for one airport, one airline or one direction. Airlines can be shown as brands, operators or groups (as defined above), and the columns can be sorted by clicking their headings. The mean delay is over the flights that operated, with early flights counted as zero; the other percentages are of the planned flights.
Code
The scripts download the CAA's files, turn them into a table of counts, check the counts against the CAA's own summaries and draw the figures. The statistics are published by the UK Civil Aviation Authority, which gives no warranty as to their accuracy.