
P8.2.4The Brusselator
The Brusselator is a theoretical model for an autocatalytic reaction. It assumes the following reaction sequence, in which species A and B are taken to be in excess with constant concentration and species D and E are removed as they are produced. The concentrations of species X and Y can show oscillatory behaviour under certain conditions.
It is convenient to introduce the scaled quantities
and to scale the time by the factor \(k_4\), which gives rise to the dimensionless equations
Starting with \(x(0) = y(0) = 1\), show how these equations predict \(x\) and \(y\) to vary for (a) \(a = 1, b = 1.8\) and (b) \(a = 1, b = 2.02\) by plotting in each case (i) \(x,y\) as functions of (dimensionless) time and (ii) \(y\) as a function of \(x\).
Show solution
We can integrate the two coupled ordinary differential equations with scipy.integrate.odeint() and plot the results in two different ways for the two sets of parameter values, \((a,b)\).
import numpy as np
from scipy.integrate import solve_ivp
from matplotlib import pyplot as plt

fig, axes = plt.subplots(nrows=2, ncols=2)


def deriv(t, X, a, b):
    """Return the derivatives dx/dt and dy/dt."""
    x, y = X
    dxdt = a - (1 + b) * x + x**2 * y
    dydt = b * x - x**2 * y
    return dxdt, dydt


x0, y0 = 1, 1


def plot_brusselator(a, b, row):
    """
    Integrate the Brusselator equations for parameters a,b and plot."""

    ti, tf = 0, 100
    soln = solve_ivp(
        deriv, (ti, tf), (x0, y0), dense_output=True, args=(a, b)
    )

    t = np.linspace(ti, tf, 1000)
    X = soln.sol(t)
    ax_left = axes[row, 0]
    ax_left.plot(t, X[0], lw=1)
    ax_left.plot(t, X[1], lw=1)
    ax_left.legend((r"$x$", r"$y$"), loc="upper right")
    ax_left.set_xlabel(r"$t$")
    ax_right = axes[row, 1]
    ax_right.plot(X[0], X[1], c="b", lw=1)
    ax_right.set_xlabel(r"$x$")
    ax_right.set_ylabel(r"$y$")


# Integrate and plot the Brusselator for each of the parameter pairs (1, 1.8)
# and (1, 2.02); the results from each calculation is plotted on a single row
# of the figure identified by row=0 or row=1
plot_brusselator(1, 1.8, 0)
plot_brusselator(1, 2.02, 1)

fig.tight_layout()
plt.show()
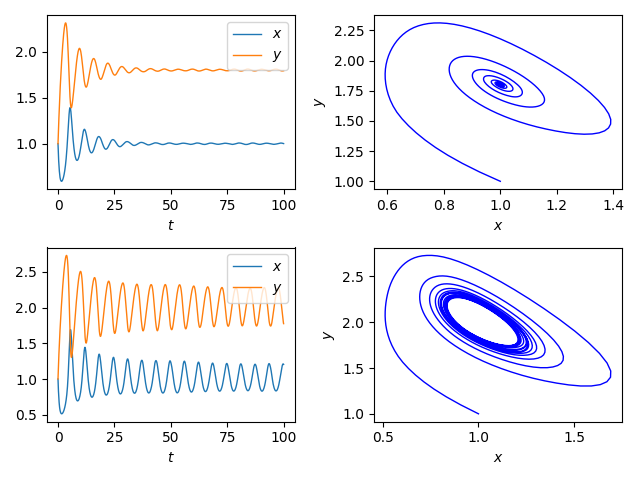
This system displays an Andronov-Hopf bifurcation at \(b_\star=a^2 + 1\): for \(b\) less this value (top two plots) there is a stable focus: the concentrations of X and Y converge on stable equilibrium values; for \(b > b_\star\) the system enters a limit cycle (bottom two plots).