P7.5.2BMI contours
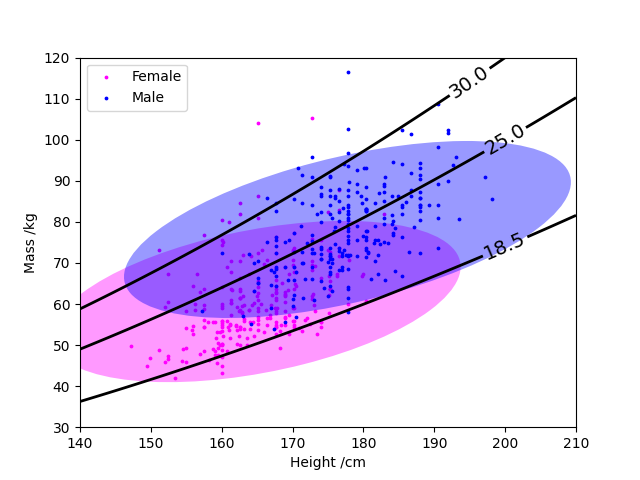
Extend the code in Example E7.17 to include contours of body mass index, defined by \(\mathrm{BMI} = (\mathrm{mass/kg})/(\mathrm{height/m})^2\). Plot these contours to delimit the supposed categories of "under-weight'' (< 18.5), "over-weight'' (> 25) and "obese'' (> 30). Manually place the contour labels so that they are out of the way of the scatter-plotted data points and format them to one decimal place.
The necessary data file is body.dat.txt, in which the final three columns are mass (kg), height (cm) and a gender flag (female=0, male=1).
Show solution
The added code is indicated in the full program below.
bmicontours
import numpy as np
import matplotlib.pyplot as plt
from matplotlib.patches import Ellipse

dt = np.dtype([("mass", "f8"), ("height", "f8"), ("gender_flag", "i2")])
data = np.loadtxt("body.dat.txt", usecols=(22, 23, 24), dtype=dt)

fig, ax = plt.subplots()


def get_cov_ellipse(cov, centre, nstd, **kwargs):
    # Find and sort eigenvalues and eigenvectors into descending order
    eigvals, eigvecs = np.linalg.eigh(cov)
    order = eigvals.argsort()[::-1]
    eigvals, eigvecs = eigvals[order], eigvecs[:, order]

    # The anti-clockwise angle to rotate our ellipse by
    vx, vy = eigvecs[:, 0][0], eigvecs[:, 0][1]
    theta = np.arctan2(vy, vx)

    # Width and height of ellipse to draw
    width, height = 2 * nstd * np.sqrt(eigvals)
    return Ellipse(
        xy=centre,
        width=width,
        height=height,
        angle=np.degrees(theta),
        **kwargs,
    )


labels, colours = ["Female", "Male"], ["magenta", "blue"]
for gender_flag in (0, 1):
    sdata = data[data["gender_flag"] == gender_flag]
    height_mean = np.mean(sdata["height"])
    mass_mean = np.mean(sdata["mass"])
    cov = np.cov(sdata["mass"], sdata["height"])
    ax.scatter(
        sdata["height"],
        sdata["mass"],
        color=colours[gender_flag],
        label=labels[gender_flag],
        s=3,
    )
    e = get_cov_ellipse(
        cov, (height_mean, mass_mean), 3, fc=colours[gender_flag], alpha=0.4
    )
    ax.add_artist(e)

# ADDITIONAL CODE HERE vvvvvv
H, M = np.meshgrid(np.linspace(140, 210, 100), np.linspace(30, 120, 100))
# Body mass index, BMI = (mass/kg)/(height/m)^2
BMI = M / (H / 100) ** 2
levels = [18.5, 25, 30]  # (<)under-weight, (>)over-weight, (>)obese
cp = ax.contour(H, M, BMI, colors="k", levels=levels, linewidths=2)
# Position the contour labels manually out of the way of the data
label_positions = [
    (lh, levels[i] * (lh / 100) ** 2) for i, lh in enumerate((200, 200, 195))
]
ax.clabel(cp, fmt="%.1f", manual=label_positions, fontsize=14)
# END OF ADDITIONAL CODE ^^^^^^

ax.set_xlim(140, 210)
ax.set_ylim(30, 120)
ax.set_xlabel("Height /cm")
ax.set_ylabel("Mass /kg")

ax.legend(loc="upper left", scatterpoints=1)
plt.show()