Question P9.2.1
The file ozone.csv gives tables for the total ozone column amounts in October in "Dobson units", and the concentrations of two chlorofluorocarbon (CFC) compounds, "F11" and "F12", in parts per trillion by volume (pptv) for the years 1957 – 1984 (The Dobson unit is defined as the thickness, in units of 0.01 mm, that a layer of pure gas would form at standard conditions for temperature and pressure from its total column amount in the atmosphere above a region of the Earth's surface.)
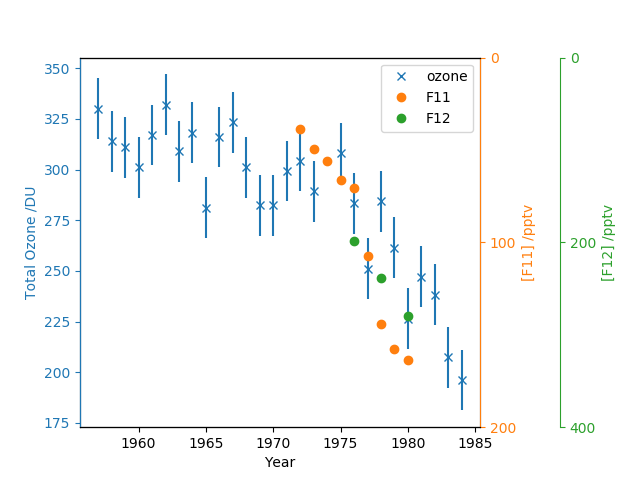
Read in and parse these data, and plot them on a suitable chart.
Data from Farman et al., Nature 315, 207 (1985).
Solution P9.2.1
The data themselves can be read in using pandas with simply:
df = pd.read_csv('ozone.csv', index_col=0, comment='#')
There are various ways of plotting these data. The simplest labels the points and axes correctly:
df.plot(marker='o', ls='')
However the plot has more impact if the CFCs are plotted on a secondary axis which is reversed, so that the ozone is shown to decrease as [F11] and [F12] increase. The uncertainty in the ozone column amount (given in the data file comments) can be indicated with errorbars.
import pandas as pd
import matplotlib.pyplot as plt

df = pd.read_csv('ozone.csv', index_col=0, comment='#')
# From the data comments, the uncertainty in the ozone column amount is 15 DU.
dO3 = 15

fig, ax = plt.subplots()
fig.subplots_adjust(right=0.75)

O3line, _, _ = ax.errorbar(df.index, df['Total Ozone /DU'], yerr=dO3,
                           marker='x', ls='', label='ozone')
ax.yaxis.label.set_color(O3line.get_color())
ax.tick_params(axis='y', colors=O3line.get_color())
ax.spines['left'].set_edgecolor(O3line.get_color())
ax.set_xlabel('Year')
ax.set_ylabel('Total Ozone /DU')

ax2 = ax.twinx()
F11line, = ax2.plot(df.index, df['[F11] /pptv'], c='tab:orange', marker='o',
                    ls='', label='F11')
ax2.set_ylim(-50, 300)
ax2.invert_yaxis()
ax2.yaxis.label.set_color(F11line.get_color())
ax2.spines['right'].set_edgecolor(F11line.get_color())
ax2.tick_params(axis='y', colors=F11line.get_color())
ax2.set_yticks([0, 100, 200])
ax2.set_ylabel('[F11] /pptv')

ax3 = ax.twinx()
F12line, = ax3.plot(df.index, df['[F12] /pptv'], c='tab:green', marker='o',
                    ls='', label='F12')
ax3.set_ylim(-100, 600)
ax3.invert_yaxis()
ax3.yaxis.label.set_color(F12line.get_color())
ax3.spines['right'].set_position(("axes", 1.2))
ax3.spines['right'].set_edgecolor(F12line.get_color())
ax3.tick_params(axis='y', colors=F12line.get_color())
ax3.set_yticks([0, 200, 400])
ax3.set_ylabel('[F12] /pptv')

# ax3 is the last Axes object to be drawn: this is the one we set to the colour
# of the ax plotted line
ax3.spines['left'].set_edgecolor(O3line.get_color())

handles, labels = ax.get_legend_handles_labels()
handles2, labels2 = ax2.get_legend_handles_labels()
handles3, labels3 = ax3.get_legend_handles_labels()
# Remove errorbars from legend marker
handles = [h[0] for h in handles] + handles2 + handles3
labels = labels + labels2 + labels3
ax.legend(handles, labels)

plt.savefig('ozone-plot.png')
plt.show()
