Solution P6.7.2
The three cases are handled in the code below.
import numpy as np
import matplotlib.pyplot as plt

n = 2048
T = 1
freq = 1 / T
duration = 2
t = np.arange(0, duration, duration/n)
f = np.ones(n)
f[(t >= T/2) & (t < T)] = -1
f[t >= T] = f[t < T]

def fourier_expansion(nterms):
    fourier_square = np.zeros(n)
    for k in range(1, nterms+1):
        fac = 2 * k - 1
        fourier_square += np.sin(2 * np.pi * fac * freq * t)/ fac
    return 4 / np.pi * fourier_square

for i, nterms in enumerate((3, 9, 18)):
    fourier_square = fourier_expansion(nterms)

    F = (duration/n) / (4/np.pi) * np.abs(np.fft.rfft(fourier_square))
    Fdft = (duration/n) / (4/np.pi) * np.abs(np.fft.rfft(f))
    Ffreq = np.fft.rfftfreq(n, duration/n)

    plt.subplot(3,2,i*2+1)
    plt.plot(t,f)
    plt.plot(t, fourier_square)
    plt.ylim(-1.5, 1.5)
    plt.subplot(3,2,(i+1)*2)
    plt.bar(Ffreq, F, color='g')
    plt.xlim(0,50)
    plt.ylim(0,1.1)

plt.tight_layout()
plt.show()
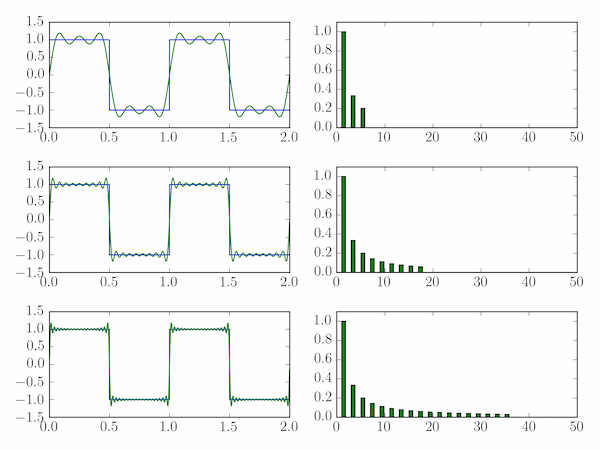
The figure produced is shown below (Fourier expansion terms are illustrated on the right.)
