Solution P6.6.3
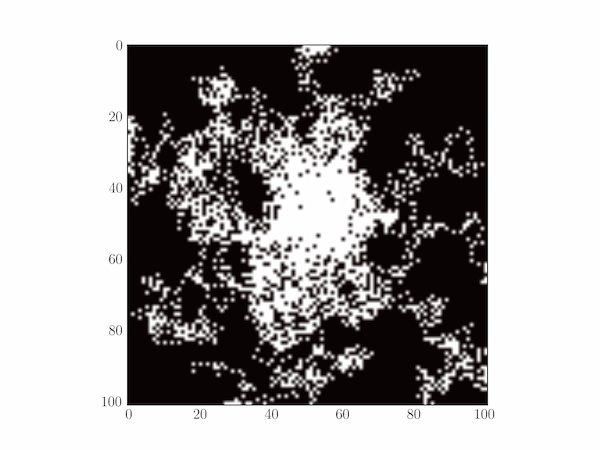
The code below tracks the bacteria positions over time on a two-dimensional plot (see Section 7.5.2 for a description of Matplotlib's imshow function.)
import numpy as np
import matplotlib.pyplot as plt

# The bacteria "world"
n = 100
world = np.zeros((n+1,n+1))

# Magnitude of step size
d = 0.02
# Number of bacteria, number of steps for each bacterium
nb, nsteps = 10, 400
# Position of the attractant
cx = cy = 0.5

# P0 is the probability of tumbling when heading toward the attractant; P1 is
# the probability of tumbling when heading away from it.
P0, P1 = 0.7, 1

def tumble():
    """Randomly pick a new direction, (dx, dy) for the bacterium."""

    theta = np.random.rand() * np.pi * 2
    return d * np.cos(theta), d * np.sin(theta)

def fpot(x, y):
    """Food potential, decreasing linearly as from (cx, cy)."""

    return -np.hypot((x-cx), (y-cy))

for b in range(nb):
    # Start the bacteria off evenly-spaced around the unit circle centred on
    # (cx, cy).
    phi = 2*np.pi*b/nb
    x, y = cx + np.cos(phi)/2, cy + np.sin(phi)/2
    # Randomly pick an initial direction for the bacterium
    dx, dy = tumble()

    for i in range(nsteps):
        # We will estimate the gradient as proportional to the difference
        # between the food potential at the next position, (x',y') and that at
        # the # current position: grad ∝ fpot(x',y') - fpot(x,y)
        grad = -fpot(x,y)

        # Update the bactrium's position (wrapping round at the world's edges
        x, y  = max(min(x+dx, 1), 0), max(min(y+dy, 1), 0)
        ix, iy = int(x * n), int(y * n)
        world[ix, iy] = 1

        # So the attractant gradient at the new position is:
        grad += fpot(x,y)

        if grad < 0:
            # We're moving away from the attractant: definitely tumble
            prob = P1
        else:
            # We're not moving away, tumble only with this probability
            prob = P0
        # Decide whethe to tumble and update direction of movement if we do
        if np.random.rand() < prob:
            dx, dy = tumble()

plt.imshow(world, cmap='hot')
plt.show()
A typical plot is depicted below.
