Question P6.3.3
The heights, in cm, of a sample of 1000 adult men and 1000 adult women from a certain population are collected in the data files ex6-3-f-male-heights.txt and ex6-3-f-female-heights.txt. Read in the data and establish the mean and standard deviation for each sex. Create histograms for the two data sets using a suitable binning interval and plot them on the same figure.
Repeat the exercise in imperial units (feet and inches).
Solution P6.3.3
A quick look at the data files shows that the 1000 heights are provided in 200 rows of five whitespace-delimited entries:
161.7 160.5 152.6 150.8 157.7
159.2 165.2 167.3 158.2 161.5
158.2 141.6 179.9 159.7 162.8
...
We could read in each file with loadtxt() and simply flatten the resulting arrays:
In [x]: fsample = np.loadtxt('ex6-3-f-female-heights.txt').flatten()
In [x]: msample = np.loadtxt('ex6-3-f-male-heights.txt').flatten()
but instead, let's use a structured array:
In [x]: heights = np.zeros((1000,), dtype={'names': ['female', 'male'],
                                   'formats': ['f8', 'f8']})
In [x]: heights['female'] = np.loadtxt('ex6-3-f-female-heights.txt').flatten()
In [x]: heights['male'] = np.loadtxt('ex6-3-f-male-heights.txt').flatten()
The mean and standard deviations are straightforward:
In [x]: fav, fstd = heights['female'].mean(), heights['female'].std()
In [x]: mav, mstd = heights['male'].mean(), heights['male'].std()
To find suitable bins for the histogram, find the minimum and maximum values. We would expect the maximum height to be in the male data set and the minimum to be in the female data set but can't be sure, so create a flattened view of all the data and use max() and min() on it:
In [x]: all_heights_view = heights.view((('f8', 2))).flatten()
In [x]: all_heights.min(), all_heights.max()
Out[x]: (138.5, 208.30000000000001)
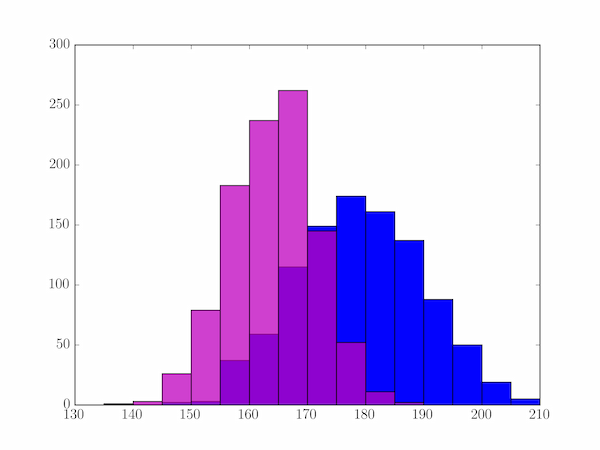
In the histogram let's use 15 bins of 5 cm between 135 and 210 cm. To plot them, call plt.hist(). This function returns a three object tuple: the histogram values, the bins and the list of patch objects forming the plotted image. We're only really interested in keeping the first of these, so we assign the others to the dummy variable _.
In [x]: bins = np.linspace(135, 210, 16)
In [x]: mhist, _, _ = plt.hist(heights['male'], bins, color='b')
In [x]: fhist, _, _ = plt.hist(heights['female'], bins, alpha=0.75, color='m')
Note that we have set the transparency of the second plot to 75% (alpha=0.75) so that it doesn't totally obscure the first where they overlap.
To summarize the data we need to iterate over the bins and both histograms, so vstack() them to form three rows and iterate over the transpose (1000 rows of three columns). Don't forget that the bins array holds the bin edges and so is one element longer than the histogram arrays:
print('Height (cm)  Female  Male')
print('-'*27)
for b, f, m in np.vstack((bins[:-1], fhist, mhist)).T:
    print('  {:d}-{:d}     {:3d}    {:3d}'.format(int(b), int(b)+5,
                                                   int(f), int(m)))
print('-'*27)
print('Mean (cm):   {:5.1f}  {:5.1f}'.format(fav, mav))
print(' Std (cm):   {:5.1f}  {:5.1f}'.format(fstd, mstd))
print('-'*27)
The output table is:
Height (cm)  Female  Male
---------------------------
  135-140       0      1
  140-145       3      0
  145-150      26      2
  150-155      79      3
  155-160     183     37
  160-165     237     59
  165-170     262    115
  170-175     145    149
  175-180      52    174
  180-185      11    161
  185-190       2    137
  190-195       0     88
  195-200       0     50
  200-205       0     19
  205-210       0      5
---------------------------
Mean (cm):   164.1  178.8
 Std (cm):     7.4   10.8
---------------------------