Question
The resistance of a wire of length $l$ and cross section area $A$ is given by $R = \rho l / A$, where $\rho$ is the resisitivity (SI units: $\mathrm{\Omega\,m}$). Over reasonably narrow temperature ranges, $R$ increases with temperature linearly: $$ R(T) = R_0[1+\alpha(T-T_0)], $$ where $\alpha$ is a constant. Fit a straight line to the following data sets and determine $\rho$ for copper and iron at the reference temperature $T_0 = 300\;\mathrm{K}$. The data are measured for a wire of circular cross sectional radius $0.1\;\mathrm{mm}$ and length $100\;\mathrm{m}$.
| $T\;/\mathrm{K}$ | $R(\mathrm{Cu})\;/\mathrm{\Omega}$ | $R(\mathrm{Fe})\;/\mathrm{\Omega}$ |
|---|---|---|
| 220.0 | 0.33 | 1.89 |
| 250.0 | 0.51 | 2.31 |
| 280.0 | 0.59 | 2.77 |
| 310.0 | 0.44 | 3.25 |
| 340.0 | 0.64 | 3.71 |
| 370.0 | 0.70 | 4.25 |
| 400.0 | 0.73 | 4.66 |
Solution
Here is one solution, giving the following output:
rho(Cu) =  1.707e-08 Ω.m
rho(Fe) =  9.760e-08 Ω.m
Two equivalent methods for fitting the straight line are given.
import numpy as np
import matplotlib.pyplot as plt
# Reference temperature.
T0 = 300
# Wire radius (r, m), length (L, m) and cross sectional area (A, m2).
r, L = 1.e-3, 100
A = np.pi * r**2
# The resistance data to fit.
R = {}
T, R['Cu'], R['Fe'] = np.array([
[220.0, 0.33, 1.89],
[250.0, 0.51, 2.31],
[280.0, 0.59, 2.77],
[310.0, 0.44, 3.25],
[340.0, 0.64, 3.71],
[370.0, 0.70, 4.25],
[400.0, 0.73, 4.66]
]).T
def get_R(T, R0, alpha):
"""Return resistance, R, at temperature T."""
return R0 * (1 + alpha * (T-T0))
def fit_line(x, y):
"""Linear fit as a simple degree-1 polynomial."""
return np.polyfit(x, y, deg=1)
def fit_line(x, y):
"""Linear fit with linalg.lstsq."""
n = len(x)
A = np.vstack((x, np.ones(n))).T
m, c = np.linalg.lstsq(A, y)[0]
return m, c
# Perform the fit and plot the data points and best fit straight line.
fig, ax = plt.subplots()
colors = {'Cu': '#B87333', 'Fe': '#888888'}
for metal in ('Cu', 'Fe'):
m, c = fit_line(T-T0, R[metal])
R0, alpha = c, m / c
rho = R0 * A / L
print('rho({}) = {:10.3e} Ω.m'.format(metal, rho))
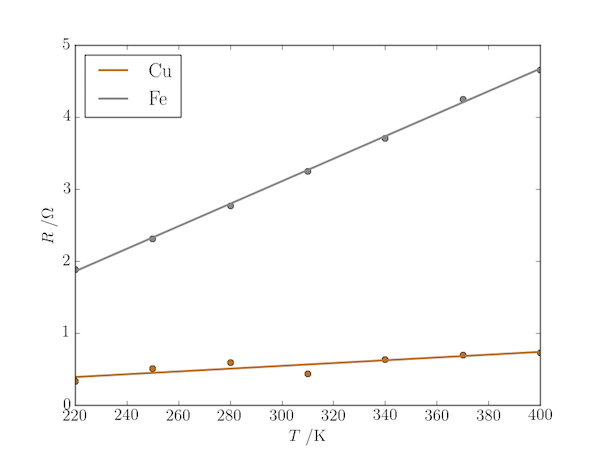
ax.plot(T, R[metal], 'o', c=colors[metal])
ax.plot(T, get_R(T, R0, alpha), '-', lw=2, c=colors[metal], label=metal)
ax.set_xlabel('$T\;/\mathrm{K}$')
ax.set_ylabel('$R\;/\mathrm{\Omega}$')
ax.legend(loc='best')
plt.savefig('resistivity_Cu_Fe.png')
plt.show()