Solution P4.6.2
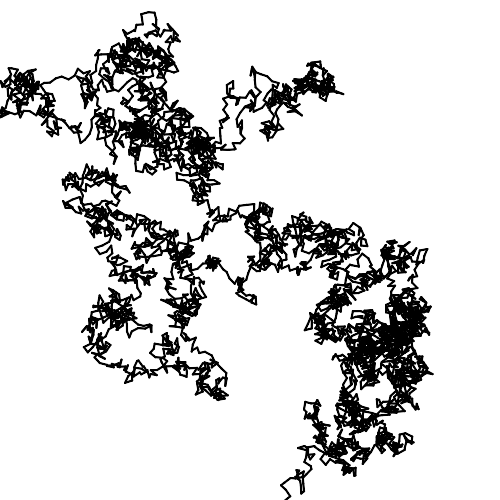
The method listed below can be called on a Polymer object to save an SVG representation of the polymer. It centres the image on a $500 \times 500$ pixel canvas and projects the monomer unit positions onto the $(x,y)$ plane.
    :::python
    def save_svg(self, svg_name='polymer.svg'):
        canvas_width = 500; canvas_height = 500
        fo = open(svg_name, 'w')
        print("""<?xml version="1.0" encoding="utf-8"?>
                 <svg xmlns="http://www.w3.org/2000/svg"
                      xmlns:xlink="http://www.w3.org/1999/xlink"
                      width="{}" height="{}" style="background: {}">""".format(
                        canvas_width, canvas_height, '#ffffff'), file=fo)

        ccx, ccy = canvas_width / 2, canvas_height / 2
        scale = 10

        x, y, z = zip(*self.xyz)
        xmin, xmax, ymin, ymax = min(x), max(x), min(y), max(y)
        dmax = max(xmax-xmin, ymax-ymin)
        scale = min(canvas_width, canvas_height) / dmax
        for i in range(1, self.N):
            x1, y1 = x[i-1]*scale + ccx, y[i-1]*scale + ccy
            x2, y2 = x[i]*scale + ccx, y[i]*scale + ccy
            print('<line x1="{:.1f}" y1="{:.1f}" x2="{:.1f}" y2="{:.1f}"'
                        ' style="stroke: {:s}; stroke-width: {:d};"/>'.format(
                   x1, y1, x2, y2, 'black', 2), file=fo)
        print('</svg>', file=fo)
An example output image is given below.
