Visualizing modular multiplication tables
Posted on 18 April 2016
Here is a short Python program to visualize the table of multiplication modulo $n$. The integers $i$ and $j = 1,2,3,\cdots,N-1$ number the rows and columns of the image plot produced. $n$ and $N$ are supplied as command line arguments (if $N$ is not supplied, it defaults to $n$).
This code is also available on my GitHub page.
import sys
import numpy as np
import matplotlib
import matplotlib.pyplot as plt
from matplotlib.ticker import FuncFormatter

def multiplication_table(n, N=None, number_labels=True):
    """Create and plot an image of a multiplication table modulo n

    The table is of ij % n for i, j = 1, 2, ..., N-1. If not supplied,
    N defaults to n. If N is a mutiple of n, the pattern is repeated
    across the created image. The "rainbow" colormap is used, but zeros
    (corresponding to factors of n) are displayed in white.

    """

    if not N:
        N=n

    # A multiplication table (modulo n)
    arr = np.fromfunction(lambda i,j:(i+1)*(j+1) % n, (N-1,N-1))

    # Select a colormap, but we'll set 0 values to white
    cmap = matplotlib.cm.get_cmap('rainbow')
    cmap.set_under('w')

    fig, ax = plt.subplots()
    # Plot an image of the multiplication table in colours for values greater
    # than 1. Zero values get plotted in white thanks to set_under, above.
    ax.imshow(arr, interpolation='nearest', cmap=cmap, vmin=1)

    # Make sure the tick marks are correct (start at 1)
    tick_formatter = FuncFormatter(lambda v, pos: str(int(v+1)))
    ax.xaxis.set_major_formatter(tick_formatter)
    ax.yaxis.set_major_formatter(tick_formatter)

    # For small n, write the value in each box of the array image.
    if number_labels and N < 21:
        for i in range(N-1):
            for j in range(N-1):
                ax.annotate(s=str((i+1)*(j+1)%n), xy=(i,j), ha='center',
                            va='center')

# The user supplies n (and optionally N) as command line arguments
n = int(sys.argv[1])
try:
    N = int(sys.argv[2])
except IndexError:
    N = None

multiplication_table(n, N, False)
plt.show()
The actual calculation of the multiplication table is done using a single fromfunction call. The first argument is the (vectorized) function to be called for the indexes i and j; the second is the shape of the array to create:
arr = np.fromfunction(lambda i,j:(i+1)*(j+1) % n, (N-1,N-1))
For example, here's a simple 12 times table (mod 12).
python multiplication_table.py 12
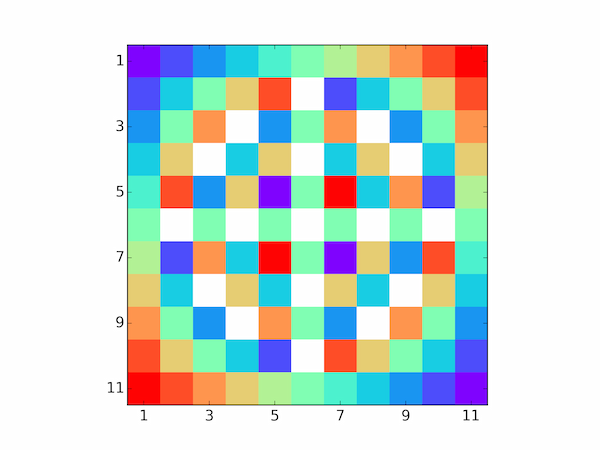
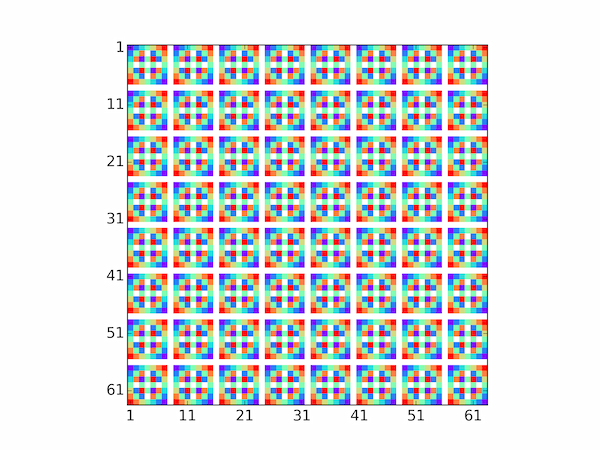
The prime factorization of $n$ shows up in the zeros of the multiplication table, which are coloured white in the generated image. Obviously, setting $N$ to a multiple of $n$ will tile the pattern into a pleasing quilt-like image:
python multiplication_table.py 8 64
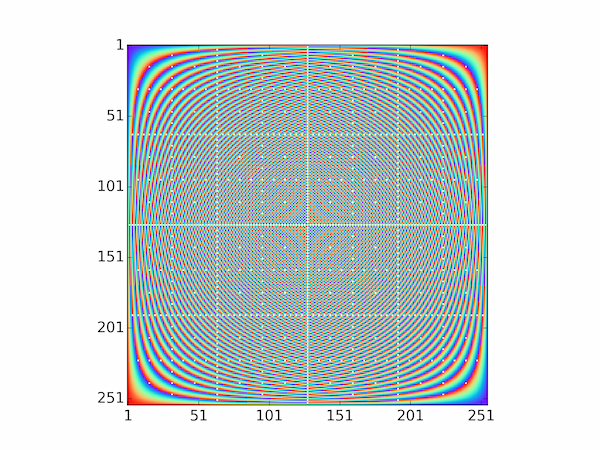
A large $n$ shows the symmetry about both diagonals due to the relations $i \times j = j \times i$ and $(n-i) \times (n-j) (\mathrm{mod}\;n) = i \times j$.
python multiplication_table.py 256
Finally, although there's no command line option for it, you can call multiplication_table with number_labels=True and for $n < 21$ it will add the numbers to the image. For example,
