The Dottie number
Posted on 17 August 2021
The Dottie number is the (real) root of the equation $\cos x = x$. As the only fixed point of the cosine function, it is the number that is converged to by the iterated function sequence $$ x, \cos(x), \cos(\cos(x)), \cos(\cos(\cos(x))), \ldots, $$ i.e. it is the number returned if you mash the COS button on your calculator enough (apparently the French professor after whom it is named did just this). Its value is about 0.7390851 and it is transcendental.
It is straightforward to calculate the Dottie number in Python, for example with:
import numpy  as np
x = 1
for i in range(1000):
    x = np.cos(x)
print(x)
The following code, however, calculates the Dottie number by this iteration but also illustrates the attraction to the fixed point on a cobweb plot.
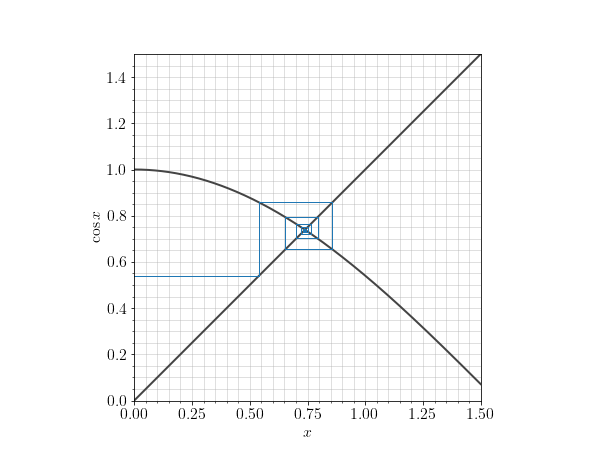
The code is a slightly improved version of that given in this previous post on cobweb plots.
import numpy as np
from matplotlib import rc
import matplotlib.pyplot as plt

# Use LaTeX throughout the figure for consistency
rc('font', **{'family': 'serif', 'serif': ['Computer Modern'], 'size': 16})
rc('text', usetex=True)
# Figure dpi
dpi = 72

def plot_cobweb(ax, f, x0, nmax=40, filename='cobweb.png', *args):
    """Make a cobweb plot.

    Illustrate the behaviour of iterating x = f(x) starting at x = x0.
    args are parameters to the function and ax is the Matplotlib Axes to plot
    the convergent cobweb on.

    """

    # Iterate x = f(x) for nmax steps, starting at (x0, f(x0)).
    px, py = np.empty((2,nmax+1,2))
    px[0], py[0] = x0, f(x0)
    for n in range(1, nmax, 2):
        px[n] = px[n-1]
        py[n] = f(px[n-1], *args)
        px[n+1] = py[n]
        py[n+1] = py[n]
        print(py[n][0])

    # Plot the path traced out by the iteration.
    ax.plot(px, py, c='tab:blue', lw=1)

    # Annotate and tidy the plot.
    ax.minorticks_on()
    ax.grid(which='minor', alpha=0.5)
    ax.grid(which='major', alpha=0.5)
    ax.set_aspect('equal')
    ax.set_xlabel('$x$')
    ax.set_ylabel(f.latex_label)
    return ax

class AnnotatedFunction:
    """A small class representing a mathematical function.

    This class is callable so it acts like a Python function, but it also
    defines a string giving its latex representation.

    """

    def __init__(self, func, latex_label):
        self.func = func
        self.latex_label = latex_label

    def __call__(self, *args, **kwargs):
        return self.func(*args, **kwargs)

func = AnnotatedFunction(lambda x: np.cos(x), r'$\cos x$')

# Plot the function y=f(x) and the line y = x.
x = np.linspace(0, 1.5, 500)
fig = plt.figure(figsize=(600/dpi, 450/dpi), dpi=dpi)
ax = fig.add_subplot(111)

# Plot y = f(x) and y = x
ax.plot(x, func(x), c='#444444', lw=2)
ax.plot(x, x, c='#444444', lw=2)
ax = plot_cobweb(ax, func, -1, 100)
# Customization to set appropriate plot limits.
ax.set_xlim(0, 1.5)
ax.set_ylim(0, 1.5)

plt.savefig('dottie.png', dpi=dpi)
plt.show()