Modular arithmetic on a circle
Posted on 28 July 2023
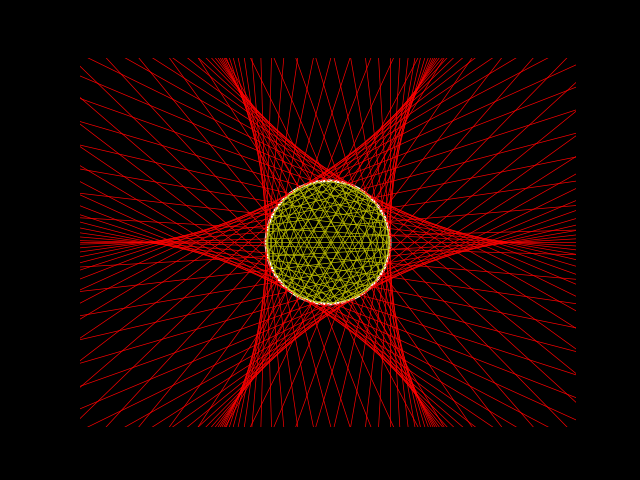
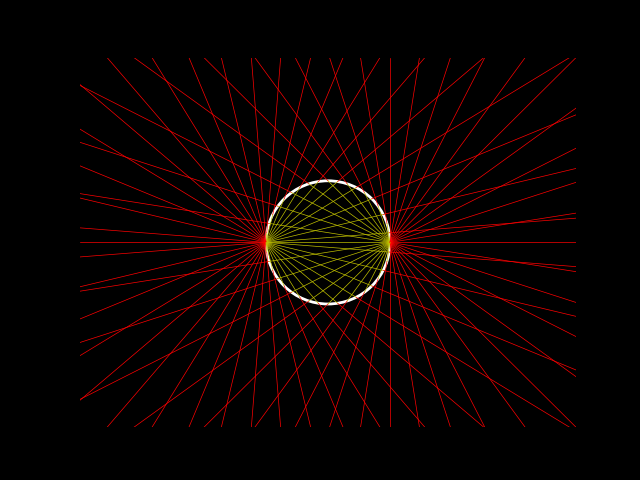
Inspired by David Richeson's applet on GeoGebra the Python script below plots the lines joining pairs of points, evenly spaced on the perimeter of a circle according to the following algorithm: label the $n$ points $k=0, 1, 2, \ldots n-1$; then join point $k$ to point $mk\,\mathrm{mod}\,n$.
The line segments inside and outside the circle can be plotted in different colours to make pleasing images. Pass $m$ and $n$ as arguments on the command line, e.g.
python circlines.py 82 110
python circlines.py 20 40
import sys
import numpy as np
import matplotlib.pyplot as plt

def add_lines(ax, m, n, line_segments=True, c='w', lw=0.5, *args, **kwargs):
    ax.add_patch(plt.Circle((0, 0), 1, fc='none', ec='w', lw=2))
    # Pop off oc ("outer line colour") if presentm otherwise set to the
    # same as the inside colour.
    oc = kwargs.pop('oc', c)

    dtheta = 2 * np.pi / n
    theta = np.arange(0, 2 * np.pi, dtheta)
    pts = np.array([np.cos(theta), np.sin(theta)]).T

    def get_bounded_coords(X, x1, y1, g):
        """
        Get the coordinates of the intersection of the line through
        (x1, y1) with gradient g at with x-coordinate X, unless this
        has a y-coordinate outside the range (YMIN, YMAX), in which case
        set y appropriately and determine the correspinding x-coordinate.
        """

        def get_x_at_y(Y):
            """Return the x-coordinate at y=Y for the line."""
            return (Y - y1) / g + x1

        yA = y1 + g * (X - x1)
        if yA > YMAX:
            return get_x_at_y(YMAX), YMAX
        elif yA < YMIN:
            return get_x_at_y(YMIN), YMIN
        return X, yA

    for k, pt1 in enumerate(pts):
        pt2 = pts[m * k % n]
        x1, y1 = pt1
        x2, y2 = pt2
        if x1 > x2:
            x1, y1, x2, y2 = x2, y2, x1, y1
        if line_segments:
            # Just join the line segments inside the circle.
            plt.plot([x1, x2], [y1, y2], c=c, lw=lw, **kwargs)
            continue

        if x1 == x2:
            # Vertical lines are a special case.
            xA, xB, yA, yB = x1, x2, YMIN, YMAX
        else:
            # The gradient of the line.
            g = (y2 - y1) / (x2 - x1)
            # Get the start and end points of the line on the boundary
            # rectangle, (XMIN, YMIN), (XMAX, YMAX).
            xA, yA = get_bounded_coords(XMIN, x1, y1, g)
            xB, yB = get_bounded_coords(XMAX, x1, y1, g)

        if oc == c:
            # Same colour inside and outside the circle.
            plt.plot([xA, xB], [yA, yB], c=c, lw=lw, **kwargs)
        else:
            plt.plot([xA, x1], [yA, y1], c=oc, lw=lw, **kwargs)
            plt.plot([x1, x2], [y1, y2], c=c, lw=lw, **kwargs)
            plt.plot([x2, xB], [y2, yB], c=oc, lw=lw, **kwargs)

if __name__ == '__main__':
    m, n = map(int, sys.argv[1:3])
    XMIN, XMAX, YMIN, YMAX = -4, 4, -3, 3
    fig, ax = plt.subplots(facecolor='k')

    add_lines(ax, m, n, c='y', line_segments=False, oc='r')

    ax.set_xlim(XMIN, XMAX)
    ax.set_ylim(YMIN, YMAX)
    ax.axis('off')
    plt.show()