P8.1.5The Theis equation
The drawdown or change in hydraulic head, \(s\) (a measure of the water pressure above some geodetic datum) a distance \(r\) from a well at time \(t\) from which water is being pumped at a constant rate, \(Q\), can be modelled using the Theis equation,
Here \(H_0\) is the hydraulic head in the absence of the well, \(S\) is the aquifer storage coefficient (volume of water released per unit decrease in \(H\) per unit area) and \(T\) is the transmissivity (a measure of how much water is transported horizontally per unit time). The Well Function, \(W(u)\) is simply the exponential integral, \(E_1(u)\).
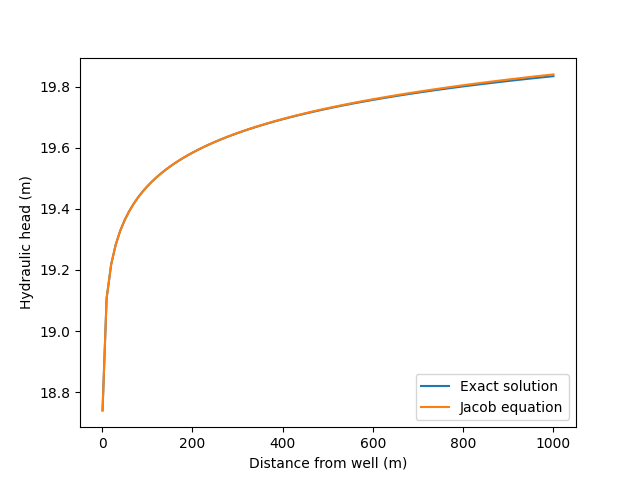
For a well being pumped at \(Q = 1000\;\mathrm{m^3\,day^{-1}}\) from an aquifer described by the parameters \(H_0 = 20\;\mathrm{m}\), \(S = 0.0003\), \(T = 1000\;\mathrm{m^2\,day^{-1}}\), determine the height of the hydraulic head as a function of \(r\) after \(t = 1\;\mathrm{day}\) of pumping.
Compare your answer with the approximate version of the Theis equation known as the Jacob equation, in which the well function is taken to be appoximately \(W(u) \approx -\gamma - \ln u\) where \(\gamma=0.577215664\cdots\) is the Euler-Mascheroni constant.
Show solution
Here is one approach:
import numpy as np
import matplotlib.pyplot as plt
from scipy.special import exp1

Q = 1000  # Pumping rate from well (m3/day)
H0 = 20  # Initial hydraulic head (m)
S = 0.0003  # Storage coefficient
T = 1000  # Transmissivity (m2/day)

t = 1  # days
# Distance from the well (m): 10 metre intervals out to 1 km.
r = np.arange(0, 1001, 10)
# NB we can't allow r = 0 m (singularity in solution).
r[0] = 1

# Well parameter and exact solution (Theis equation) using exponential integral
u = r**2 * S / 4 / T / t
H = H0 - Q / 4 / np.pi / T * exp1(u)

# Approximate solution (Jacob equation) using W(u) ~ -gamma - ln u
H_jacob = H0 - Q / 4 / np.pi / T * np.log(np.exp(-np.euler_gamma) / u)

plt.plot(r, H, label="Exact solution")
plt.plot(r, H_jacob, label="Jacob equation")
plt.xlabel("Distance from well (m)")
plt.ylabel("Hydraulic head (m)")
plt.legend(loc=4)
plt.show()
This program produces the plot below