
Q7.4.1Plotting on a log scale
Compare plots of \(y=x^3\) for \(-10 \le x \le 10\) using a logarithmic scale on the \(x\)-axis, \(y\)-axis, and both axes. What is the difference between using ax.set_xscale('log') and ax.set_xscale('symlog')?
Show solution
The code below produces the six required plots.
logscales
import matplotlib.pyplot as plt
import numpy as np

x = np.linspace(-10, 10, 1000)
y = x**3

fig = plt.figure()


def do_plot(ax_no, axes, scale_type):
    ax = fig.add_subplot(3, 2, ax_no)
    ax.set_title("({})".format(chr(96 + ax_no)))
    ax.plot(x, y)
    for axis in axes:
        if axis == "x":
            ax.set_xscale(scale_type)
        else:
            ax.set_yscale(scale_type)
            if scale_type == "log":
                ax.set_yticks([1e-4, 1e-2, 0, 10, 1000])
                ax.set_ylim(1e-4, 1000)
            if scale_type == "symlog":
                ax.set_yticks([-1000, -10, 0, 10, 1000])


do_plot(1, ("x",), "log")
do_plot(2, ("x",), "symlog")
do_plot(3, ("y",), "log")
do_plot(4, ("y",), "symlog")
do_plot(5, ("x", "y"), "log")
do_plot(6, ("x", "y"), "symlog")

fig.tight_layout()
plt.show()
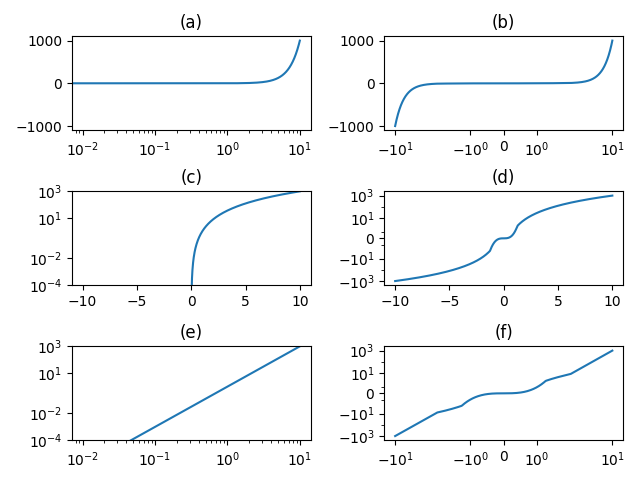
(a) \(x\)-axis log, \(y\)-axis linear
(b) \(x\)-axis symlog, \(y\)-axis linear
(c) \(x\)-axis linear, \(y\)-axis log
(d) \(x\)-axis linear, \(y\)-axis symlog
(e) \(x\)-axis log, \(y\)-axis log
(f) \(x\)-axis symlog, \(y\)-axis symlog