P7.4.1The Big Mac index
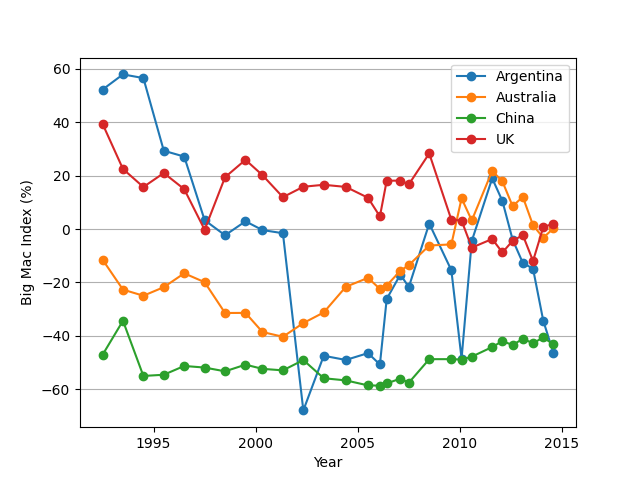
The Economist's Big Mac Index is a light-hearted measure of purchasing power parity between two currencies. Its premise is that the difference between the price of a McDonald's Big Mac hamburger in one currency (converted into US dollars (USD) at the prevailing exchange rate) and its price in the United States is a measure of the extent to which that currency is over- or under-valued (relative to the dollar).
The archive bigmac-indexes.zip contains the following data files providing the historical Big Mac prices and exchange rates for five currencies:
argentina-bigmac.txtaustralia-bigmac.txtchina-bigmac.txtuk-bigmac.txtus-bigmac.txt
For each of the first four currencies, calculate the percentage over- or under-valuation of each currency as:
\[\frac{(\mathrm{local\;price\;converted\;to\;USD} - \mathrm{US\;price})}{(\mathrm{US\;price})} \times 100\]
and plot it as a function of time.
Show solution
The following code is one approach:
bigmacindex
import numpy as np
import matplotlib.pyplot as plt

# US Big Mac prices, bm_us, as a function of time
month, year, bm_us = np.loadtxt("us-bigmac.txt", skiprows=1, unpack=True)

fig, ax = plt.subplots()
bmi = {}
countries = ["Argentina", "Australia", "China", "UK"]
for country in countries:
    filename = f"{country.lower()}-bigmac.txt"
    # Load this country's price and exchange rate data
    _, _, cur_price, ex_rate = np.loadtxt(filename, skiprows=1, unpack=True)
    # Calculate and plot the Big Mac Index as a percentage
    bmi[country] = ((cur_price / ex_rate) - bm_us) / bm_us * 100
    ax.plot(year + month / 12, bmi[country], "o-", label=country)
ax.legend()
ax.yaxis.grid()
ax.set_xlabel("Year")
ax.set_ylabel("Big Mac Index (%)")
plt.show()