Learning Scientific Programming with Python (2nd edition)
E7.15: Using ax.vlines and ax.hlines
The code below illustrates some different uses of ax.vlines and
ax.hlines.
import numpy as np
import matplotlib.pyplot as plt

fig, ax = plt.subplots()
ax.axis("equal")

# A circle made of horizontal lines
y = np.linspace(-1, 1, 100)
xmax = np.sqrt(1 - y**2)
ax.hlines(y, -xmax, xmax, color="g", lw=0.5)

# Some evenly-spaced vertical lines
ax.vlines(y[::10], -1, 1, color="b")

# Draw a box of thicker lines around the circle
ax.vlines(-1, -1, 1, lw=2, color="r")
ax.vlines(1, -1, 1, lw=2, color="r")
ax.hlines(-1, -1, 1, lw=2, color="r")
ax.hlines(1, -1, 1, lw=2, color="r")

# Remove tick marks and labels
ax.xaxis.set_visible(False)
ax.yaxis.set_visible(False)
# A bit of padding around the outside of the box
ax.set_xlim(-1.1, 1.1)
ax.set_ylim(-1.1, 1.1)

plt.show()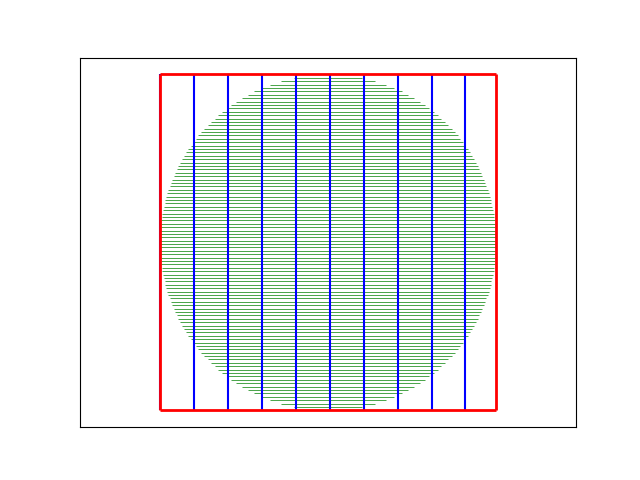
An image made using ax.vlines and ax.hlines.