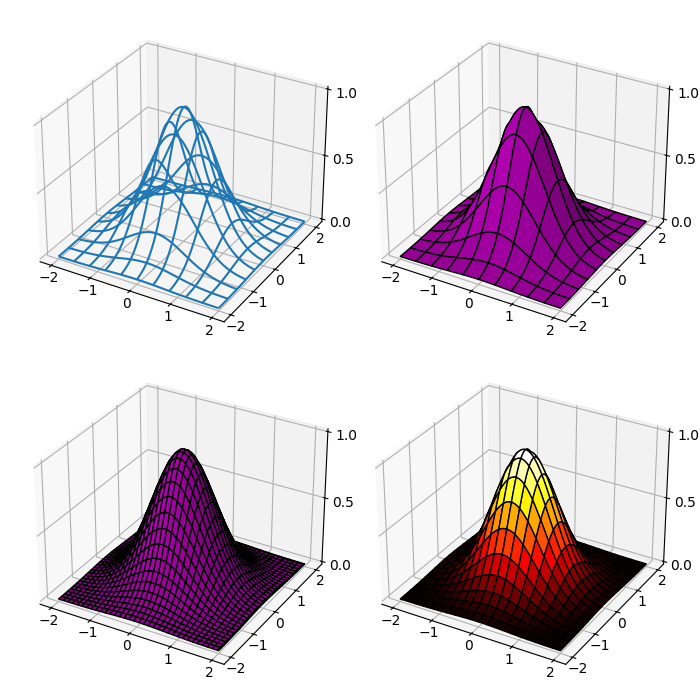
E7.25Simple surface plots
Some of the different options for producing surface plots are illustrated by the code below.
surfaceplots
import numpy as np
import matplotlib.pyplot as plt
from mpl_toolkits.mplot3d import Axes3D
import matplotlib.cm as cm

L, n = 2, 400
x = np.linspace(-L, L, n)
y = x.copy()
X, Y = np.meshgrid(x, y)
Z = np.exp(-(X**2 + Y**2))

fig, ax = plt.subplots(
    nrows=2, ncols=2, subplot_kw={"projection": "3d"}, figsize=(7, 7)
)
ax[0, 0].plot_wireframe(X, Y, Z, rstride=40, cstride=40)
ax[0, 1].plot_surface(
    X, Y, Z, rstride=40, cstride=40, color="m", edgecolors="k"
)
ax[1, 0].plot_surface(
    X, Y, Z, rstride=12, cstride=12, color="m", edgecolors="k"
)
ax[1, 1].plot_surface(
    X, Y, Z, rstride=20, cstride=20, cmap=cm.hot, edgecolors="k"
)
for axes in ax.flatten():
    axes.set_xticks([-2, -1, 0, 1, 2])
    axes.set_yticks([-2, -1, 0, 1, 2])
    axes.set_zticks([0, 0.5, 1])
    axes.tick_params(axis="x", which="major", pad=-5)
    axes.tick_params(axis="y", which="major", pad=-5)
    axes.tick_params(axis="z", which="major", pad=0)
fig.tight_layout()
plt.show()