E7.4Lifetimes of an exponential decay
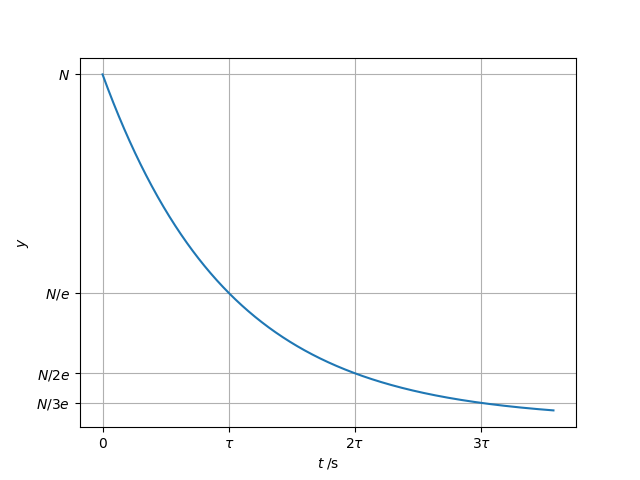
The following program plots the exponential decay described by \(y = Ne^{-t/\tau}\) labeled by lifetimes, (\(n\tau\) for \(n = 0, 1, \cdots\)) such that after each lifetime the value of \(y\) falls by a factor of \(e\).
The \(x\)-axis tick labels have been set to \(1, \tau, 2\tau, ...\) and the \(y\)-axis tick labels to \(N, N/e, N/2e, ...\)
Note that the length of the sequence of tick labels must correspond to that of the list of tick values required.
exponentialdecay
import numpy as np
import matplotlib.pyplot as plt

# Initial value of y at t=0, lifetime in s
N, tau = 10000, 28
# Maximum time to consider (s)
tmax = 100
# A suitable grid of time points, and the exponential decay itself
t = np.linspace(0, tmax, 1000)
y = N * np.exp(-t / tau)

fig, ax = plt.subplots()
ax.plot(t, y)

# The number of lifetimes that fall within the plotted time interval
ntau = tmax // tau + 1
# xticks at 0, tau, 2*tau, ..., ntau*tau; yticks at the corresponding y-values
xticks = [i * tau for i in range(ntau)]
yticks = [N * np.exp(-i) for i in range(ntau)]
ax.set_xticks(xticks)
ax.set_yticks(yticks)

# xtick labels: 0, tau, 2tau, ...
xtick_labels = [r"$0$", r"$\tau$"] + [rf"${k}\tau$" for k in range(2, ntau)]
ax.set_xticklabels(xtick_labels)
# corresponding ytick labels: N, N/e, N/2e, ...
ytick_labels = [r"$N$", r"$N/e$"] + [rf"$N/{k}e$" for k in range(2, ntau)]
ax.set_yticklabels(ytick_labels)

ax.set_xlabel(r"$t\;/\mathrm{s}$")
ax.set_ylabel(r"$y$")
ax.grid()
plt.show()