P6.2.3Immunization rates
The World Bank provides an extensive collection of data sets on a wide range of "indicators''. Data sets concerning child immunization rates for BCG (against tuberculosis), Pol3 (Polio) and measles in three South-East Asian countries between 1960 and 2013 are given in the file wb-data.dat. Fields are delimited by semicolons and missing values are indicated by '..'.
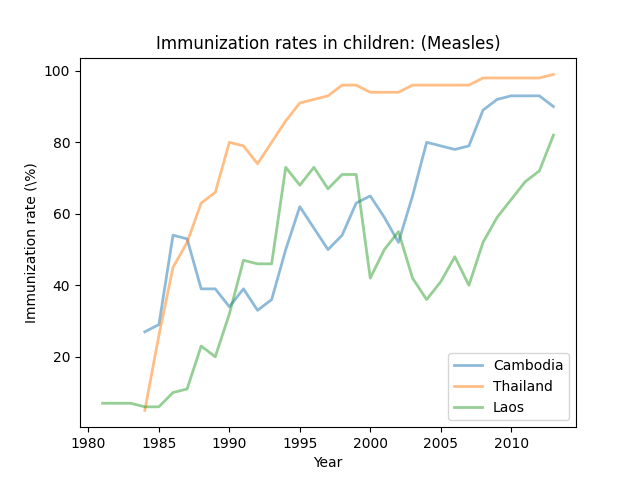
Use NumPy methods to read in this data and create three plots (one for each vaccine) comparing immunization rates in the three countries.
Show solution
This solution uses numpy.genfromtxt to read in the data.
immunization
import numpy as np
import matplotlib.pyplot as plt

filename = "wb-data.dat"
data = np.genfromtxt(
    filename, skip_header=1, missing_values="..", delimiter=";"
)
years = np.linspace(1960, 2013, 54).astype(int)
cambodia_data, thailand_data, laos_data = data[:3], data[3:6], data[6:]


def plot_data(data, vaccine):
    plt.plot(years, data[0, 4:], lw=2, alpha=0.5, label="Cambodia")
    plt.plot(years, data[1, 4:], lw=2, alpha=0.5, label="Thailand")
    plt.plot(years, data[2, 4:], lw=2, alpha=0.5, label="Laos")
    plt.xlabel("Year")
    plt.ylabel(r"Immunization rate (\%)")
    plt.title("Immunization rates in children: ({})".format(vaccine))
    plt.legend(loc=4)
    plt.show()


plot_data(data[::3], "BCG")
plot_data(data[1::3], "Pol3")
plot_data(data[2::3], "Measles")