E6.20The normal distribution
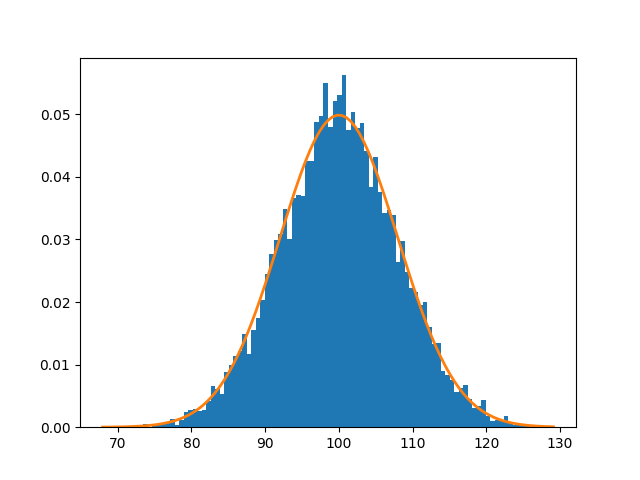
The normal distribution may be plotted from sampled data as a histogram:
normaldistribution
import numpy as np
import matplotlib.pyplot as plt

# Take N samples from the normal distribution with mean mu and
# standard deviation sigma:
N = 10000
mu, sigma = 100.0, 8.0
samples = np.random.normal(loc=mu, scale=sigma, size=N)
# Plot a histogram of the sampled data, normalizing its area to 1.
counts, bins, patches = plt.hist(samples, bins=100, density=True)
# Plot the distribution itself on top of the histogram:
dist = (
    1
    / (sigma * np.sqrt(2 * np.pi))
    * np.exp(-((bins - mu) ** 2) / (2 * sigma**2))
)
plt.plot(bins, dist)
plt.show()
The code above draws \(N\) samples from the normal distribution characterized by a mean, \(\mu\), and standard deviation, \(\sigma\):
\[f(x; \mu, \sigma) = \frac{1}{\sigma\sqrt{2\pi}} \exp
\left(
-\frac{(x-\mu)^2}{2\sigma^2}
\right)\]