E6.5argmax and argmin
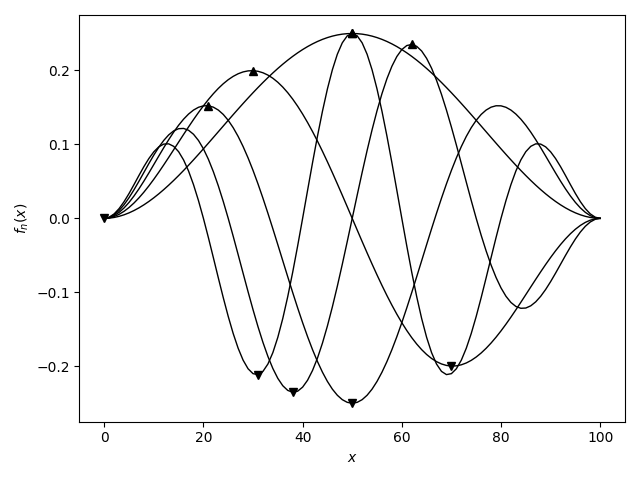
Consider the following oscillating functions on the interval \([0,L]\):
\[f_n(x) = x(L-x) \sin\frac{2\pi x}{\lambda_n}; \quad \lambda_n = \frac{2L}{n}, \quad n = 1,2,3,\cdots.\]
The following code defines a two-dimensional array holding values of these functions for \(L=1\) on a grid of \(N=100\) points (rows) for \(n=1,2,\cdots,5\) (columns). The position of the maximum and minimum in each column is calculated with argmax(axis=0) and argmin(axis=0).
argminargmax
import numpy as np
import matplotlib.pyplot as plt


N = 100
L = 1


def f(i, n):
    x = i * L / N
    lam = 2 * L / (n + 1)
    return x * (L - x) * np.sin(2 * np.pi * x / lam)


a = np.fromfunction(f, (N + 1, 5))
min_i = a.argmin(axis=0)
max_i = a.argmax(axis=0)
plt.plot(a, c="k", lw=1)
plt.plot(min_i, a[min_i, np.arange(5)], "v", c="k", markersize=6)
plt.plot(max_i, a[max_i, np.arange(5)], "^", c="k", markersize=6)
plt.xlabel(r"$x$")
plt.ylabel(r"$f_n(x)$")

plt.show()