Learning Scientific Programming with Python (2nd edition)
E9.7: Reading an Excel sheet into a pandas DataFrame
The Excel file bond-lengths.xlsx contains data on the bond lengths, vibrational constants and dissociation energies of some diatomic molecules. The single sheet is named "Diatomics". Column A contains the molecular formula; the first row is a title, and the second row contains the column names. There is also a footer of two lines, as shown in the screenshot below.
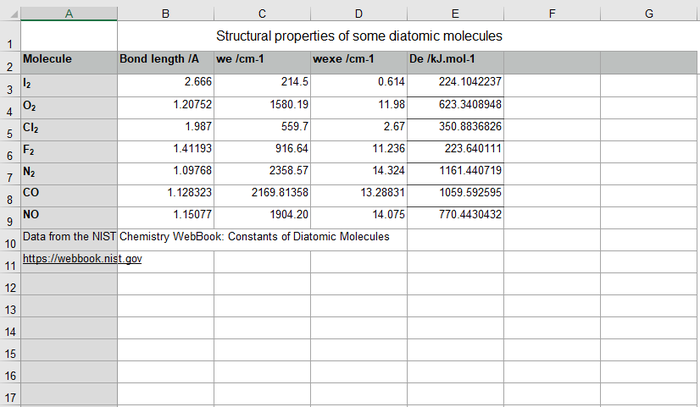
An Excel spreadsheet of diatomic bond properties
The following statement can be used to read in a DataFrame containing these data:}
import pandas as pd
df = pd.read_excel('bond-lengths.xlsx',
        index_col=0,            # the first column contains the index labels
        skipfooter=2,           # ignore the last two lines of the sheet
        header=1,               # take the column names from the second row
        usecols='A:E',          # use Excel columns labeled A-E
        sheet_name='Diatomics'  # take data from this sheet
        )

print(df)
Note: To run this code, it is necessary to have installed the openpyxl library, for example (in a virtual environment) with pip install openpyxl.
          Bond length /A    we /cm-1  wexe /cm-1  De /kJ.mol-1
Molecule
I2              2.666000   214.50000     0.61400    224.104224
O2              1.207520  1580.19000    11.98000    623.340895
Cl2             1.987000   559.70000     2.67000    350.883683
F2              1.411930   916.64000    11.23600    223.640111
N2              1.097680  2358.57000    14.32400   1161.440719
CO              1.128323  2169.81358    13.28831   1059.592595
NO              1.150770  1904.20000    14.07500    770.443043