Learning Scientific Programming with Python (2nd edition)
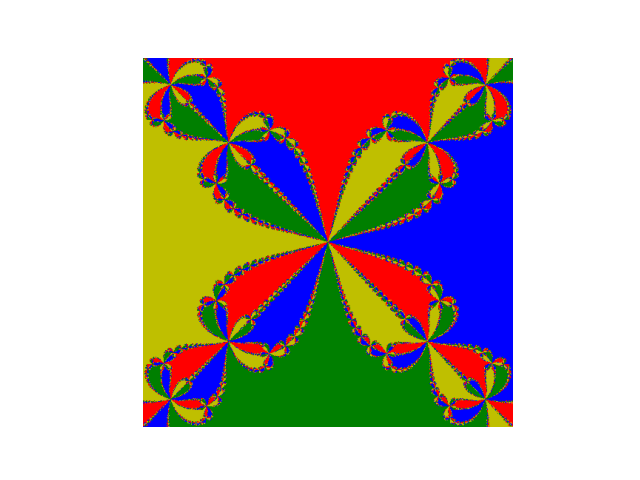
E8.27: The Newton fractal
The Newton–Raphson method for finding the roots of a function takes an initial guess to a root, $x_0$, and seeks successively better approximations of it as: $$ x_{n+1} = x_n - \frac{f(x_n)}{f'(x_n)}. $$ That is, at each iteration, the root is approximated as $x_{n+1}$, the $x$-axis intercept of the tangent to the graph at $f(x_n)$. When applied to functions of a complex variable $z$, the method can be used to create interesting fractals by considering which root it converges to for a set of numbers in the complex plane. The code below generates a fractal image by coloring those points in the complex plane used as the initial guess by the root found.
import numpy as np
import matplotlib.pyplot as plt
from matplotlib.colors import ListedColormap

# A list of colors to distinguish the roots.
colors = ["b", "r", "g", "y"]

TOL = 1.0e-8


def newton(z0, f, fprime, MAX_IT=1000):
    """The Newton-Raphson method applied to f(z).

    Returns the root found, starting with an initial guess, z0, or False
    if no convergence to tolerance TOL was reached within MAX_IT iterations.

    """

    z = z0
    for i in range(MAX_IT):
        dz = f(z) / fprime(z)
        if abs(dz) < TOL:
            return z
        z -= dz
    return False


def plot_newton_fractal(f, fprime, n=200, domain=(-1, 1, -1, 1)):
    """Plot a Newton Fractal by finding the roots of f(z).

    The domain used for the fractal image is the region of the complex plane
    (xmin, xmax, ymin, ymax) where z = x + iy, discretized into n values along
    each axis.

    """

    roots = []
    m = np.zeros((n, n))

    def get_root_index(roots, r):
        """Get the index of r in the list roots.

        If r is not in roots, append it to the list.

        """

        try:
            return np.where(np.isclose(roots, r, atol=TOL))[0][0]
        except IndexError:
            roots.append(r)
            return len(roots) - 1

    xmin, xmax, ymin, ymax = domain
    for ix, x in enumerate(np.linspace(xmin, xmax, n)):
        for iy, y in enumerate(np.linspace(ymin, ymax, n)):
            z0 = x + y * 1j
            r = newton(z0, f, fprime)
            if r is not False:
                ir = get_root_index(roots, r)
                m[iy, ix] = ir
    nroots = len(roots)
    if nroots > len(colors):
        # Use a "continuous" colormap if there are too many roots.
        cmap = "hsv"
    else:
        # Use a list of colors for the colormap: one for each root.
        cmap = ListedColormap(colors[:nroots])
    plt.imshow(m, cmap=cmap, origin="lower")
    plt.axis("off")
    plt.show()


f = lambda z: z**4 - 1
fprime = lambda z: 4 * z**3

plot_newton_fractal(f, fprime, n=500)
The Newton fractal for the function $f(z) = z^4 - 1$.