Learning Scientific Programming with Python (2nd edition)
E8.5: The gamma function
The gamma function is related to the factorial by $\Gamma(x) = (x-1)!$ and both are plotted in the code below. Note that $\Gamma(x)$ is not defined for negative integer $x$, which leads to discontinuities in the plot.
import numpy as np
from scipy.special import gamma
import matplotlib.pyplot as plt

# The Gamma function
ax = np.linspace(-5, 5, 1000)
plt.plot(ax, gamma(ax), ls="-", c="k", label="$\Gamma(x)$")

# (x-1)! for x = 1, 2, ..., 6
ax2 = np.linspace(1, 6, 6)
xm1fac = np.array([1, 1, 2, 6, 24, 120])
plt.plot(
    ax2,
    xm1fac,
    marker="*",
    markersize=10,
    markeredgecolor="r",
    markerfacecolor="r",
    ls="",
    c="r",
    label="$(x-1)!$",
)

plt.ylim(-50, 50)
plt.xlim(-5, 5)
plt.xlabel("$x$")
plt.legend()
plt.show()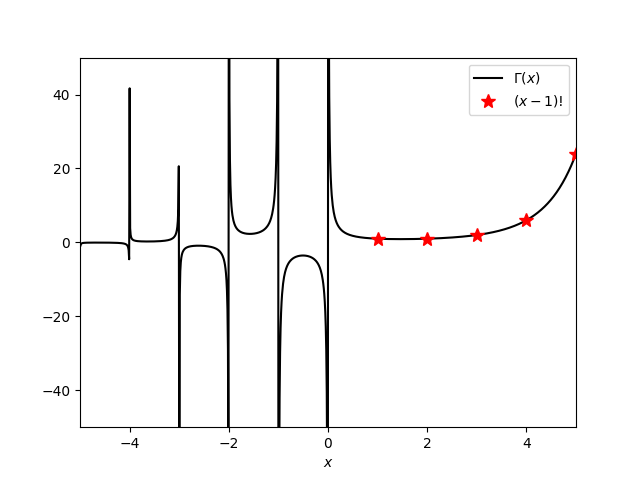
The gamma and factorial functions.