The data provided in the comma-separated file birthday-data.csv
gives the number births recorded by the US Centers for Disease Control and Prevention's National Center for Health Statistics for each day of the year as a total from years 1969-1988. The columns are: month number (1=January, 12=December), day number, and number of live births.
Use NumPy to estimate, for each day of the year, the probability of someone's birthday being on that day. Plot the probabilities as a heatmap like that of Example E7.23 and investigate any features of interest.
Hint: the data need "cleaning" to a small extent – inspect the data file first to establish the presence of any incorrect entries.
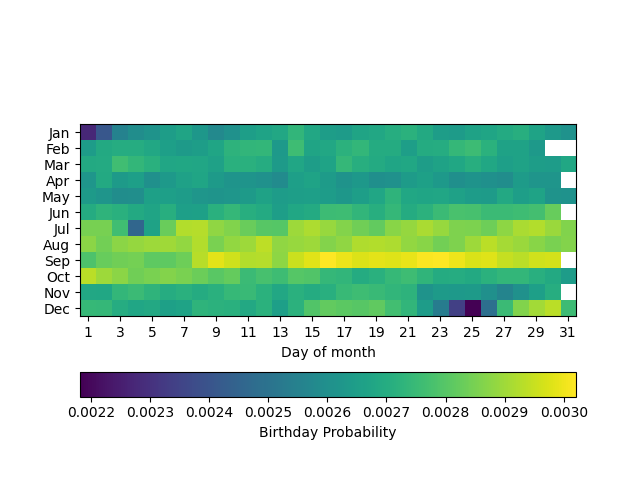
Here is one solution. We check that the date is valid (for example, not 31 June) before including it in the probability calculation.
import numpy as np
import matplotlib.pyplot as plt
# Read in the relevant data from our input file
dt = np.dtype([('month', np.int), ('day', np.int), ('n', np.float)])
data = np.genfromtxt('birthday-data.csv',dtype=dt, delimiter=',', skip_header=1)
total = np.sum(data['n'])
# In our heatmap, nan will mean "no such date", e.g. 31 June
heatmap = np.empty((12, 31))
heatmap[:] = np.nan
# Maximum number of days per month
mdpm = np.array([31,29,31,30,31,30,31,31,30,31,30,31])
for month, day, n in data:
# NumPy arrays are zero-indexed; days and months are not!
imonth, iday = month-1, day-1
if day > mdpm[imonth]:
continue
heatmap[imonth, iday] = n / total
heatmap[1,28] *= 4
# Plot the heatmap, customize and label the ticks
fig = plt.figure()
ax = fig.add_subplot(111)
im = ax.imshow(heatmap, interpolation='nearest')
ax.set_yticks(range(12))
ax.set_yticklabels(['Jan', 'Feb', 'Mar', 'Apr', 'May', 'Jun',
'Jul', 'Aug', 'Sep', 'Oct', 'Nov', 'Dec'])
days = np.array(range(0, 31, 2))
ax.set_xticks(days)
ax.set_xticklabels(['{:d}'.format(day+1) for day in days])
ax.set_xlabel('Day of month')
# Add a colour bar along the bottom and label it
cbar = fig.colorbar(ax=ax, mappable=im, orientation='horizontal')
cbar.set_label('Birthday Probability')
plt.show()
Note the relatively low chance of a birthday falling on Christmas Day, New Years Day and July 4, perhaps because these are unpopular dates for elective Caesarians.