Learning Scientific Programming with Python (2nd edition)
E7.21: Visualizing a matrix with imshow
The following code compares two interpolation schemes, 'bilinear' (which, for a small array will make a blurry image) and 'nearest' which should look "blocky" (i.e. more faithful to the data).
import numpy as np
import matplotlib.pyplot as plt
import matplotlib.cm as cm

# Make an array with ones in the shape of an 'X'
a = np.eye(10, 10)
a += a[::-1, :]

fig, axes = plt.subplots(nrows=1, ncols=2)
ax1, ax2 = axes

# Bilinear interpolation - this will look blurry
ax1.imshow(a, interpolation="bilinear", cmap=cm.Greys_r)

# 'nearest' interpolation - faithful but blocky
ax2.imshow(a, interpolation="nearest", cmap=cm.Greys_r)

plt.show()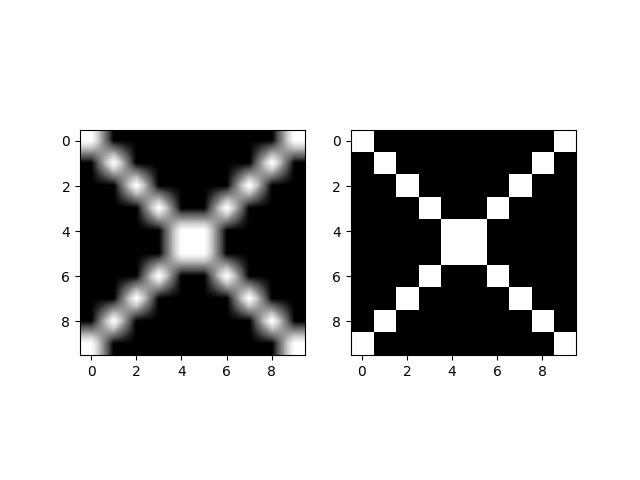
Visualization of a matrix using bilinear interpolation (left) and "nearest" interpolation (right).