Learning Scientific Programming with Python (2nd edition)
E7.5: Tick mark customization
The following program creates a plot with both major and minor tick marks, customized to be thicker and wider than the default, with the major tick marks point into and out of the plot area.
import numpy as np
import matplotlib.pyplot as plt

# A selection of functions on rn abcissa points for 0 <= x < 1
rn = 100
rx = np.linspace(0, 1, rn, endpoint=False)


def tophat(rx):
    """Top hat function: y = 1 for x < 0.5, y=0 for x >= 0.5"""
    ry = np.ones(rn)
    ry[rx >= 0.5] = 0
    return ry


# A dictionary of functions to choose from
ry = {
    "half-sawtooth": lambda rx: rx.copy(),
    "top-hat": tophat,
    "sawtooth": lambda rx: 2 * np.abs(rx - 0.5),
}

# Repeat the chosen function nrep times
nrep = 4
x = np.linspace(0, nrep, nrep * rn, endpoint=False)
y = np.tile(ry["top-hat"](rx), nrep)

fig, ax = plt.subplots()
ax.plot(x, y, "k", lw=2)
# Add a bit of padding around the plotted line to aid visualization
ax.set_ylim(-0.1, 1.1)
ax.set_xlim(x[0] - 0.5, x[-1] + 0.5)
# Customize the tick marks and turn the grid on
ax.minorticks_on()
ax.tick_params(which="major", length=10, width=2, direction="inout")
ax.tick_params(which="minor", length=5, width=2, direction="in")
ax.grid(which="both", ls=":")
plt.show()
The np.tile method constructs an array by repeating a given array nrep times. To plot a different periodic function, choose 'half-sawtooth' or 'sawtooth' here.
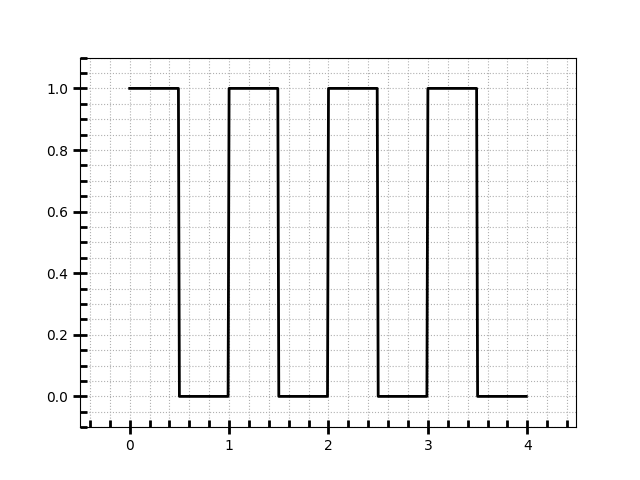
A square wave plot with customized tick marks.